
As teams moved their deployment infrastructure to containers, monitoring and logging methods changed a lot. Storing logs in containers or VMs just doesn’t make sense – they’re both way too ephemeral for that. This is where solutions like Kubernetes DaemonSet come in.
Since pods are ephemeral as well, managing Kubernetes logs is challenging. That’s why it makes sense to collect logs from every node and send them to some sort of central location outside the Kubernetes cluster for persistence and later analysis.
A DaemonSet pattern lets you implement node-level monitoring agents in Kubernetes easily. This approach doesn’t force you to apply any changes to your application and uses little resources.
Dive into the world of DaemonSets to see how they work on a practical example of network traffic monitoring.
What is Kubernetes DaemonSet? Intro to node-level monitoring in Kubernetes
A DaemonSet in Kubernetes is a specific kind of workload controller that ensures a copy of a pod runs on either all or some specified nodes within the cluster. It automatically adds pods to new nodes and removes pods from removed nodes.
This makes DaemonSet ideal for tasks like monitoring, logging, or running a network proxy on every node.
DaemonSet vs. Deployment
While a Deployment ensures that a specified number of pod replicas run and are available across the nodes, a DaemonSet makes sure that a copy of a pod runs on all (or some) nodes in the cluster. It’s a more targeted approach that guarantees that specific services run everywhere they’re needed.
DaemonSets provide a unique advantage in scenarios where consistent functionality across every node is crucial. This is particularly important for node-level monitoring within Kubernetes.
By deploying a monitoring agent via DaemonSet, you can guarantee that every node in your cluster is equipped with the tools necessary for monitoring its performance and health. This level of monitoring is vital for early detection of issues, load balancing, and maintaining overall cluster efficiency.
An alternative approach – which involves manually deploying these agents or using other types of workload controllers like Deployments – could lead to inconsistencies and gaps in monitoring.
For example, without a DaemonSet, a newly added node might remain unmonitored until it’s manually configured. This gap could pose a risk to both the performance and security of the entire cluster.
The benefits of DaemonSets
DaemonSets automate this process, ensuring that each node is brought under the monitoring umbrella without any manual intervention as soon as it joins the cluster.
Furthermore, DaemonSets aren’t just about deploying the monitoring tools. They also manage the lifecycle of these tools on each node. When a node is removed from the cluster, the DaemonSet ensures that the associated monitoring tools are also cleanly removed, keeping your cluster neat and efficient.
In essence, Kubernetes DaemonSets simplify the process of maintaining a high level of operational awareness across all nodes.
They provide a hands-off, automated solution that ensures no node goes unmonitored, enhancing the reliability and performance of Kubernetes clusters. This makes DaemonSets an indispensable tool in the arsenal of Kubernetes cluster administrators, particularly for tasks like node-level monitoring that require uniform deployment across all nodes.
Head over to K8s docs for details about the Kubernetes DaemonSet feature.
How do DaemonSets work?
A DaemonSet is a Kubernetes object that is actively controlled by a controller. You can define whatever state you wish for it – for example, declare that a specific pod should be present on all nodes.
The tuning control loop compares the intended state to what is currently happening. If a matching pod doesn’t exist on the monitored node, the DaemonSet controller will create one for you. This automated approach applies to both existing and newly created nodes.
By default, the DaemonSet creates pods on all nodes. You can use the node selector to limit the number of nodes it can accept. The DaemonSet controller will only create pods on nodes that match the YAML file’s preset nodeSelector field.
Here’s a DaemonSet example for creating nginx pods only on nodes that have `disktype=ssd` label:
```yaml
apiVersion: apps/v1
kind: DaemonSet
metadata:
  labels:
    app: nginx
  name: nginx-daemonset
spec:
  selector:
    matchLabels:
      name: nginx-pod
  template:
    metadata:
      labels:
        name: nginx-pod
    spec:
      containers:
      - image: nginx:latest
        name: nginx-container
        ports:
        - containerPort: 80
      nodeSelector:
        disktype: ssd
```
When you add a new node to the cluster, that pod is also added to the new node. When a node is removed (or the cluster shrinks), Kubernetes automatically garbage-collects that pod.
Network traffic monitoring with DaemonSet
In the ever-evolving landscape of network management, understanding and overseeing network traffic is pivotal.
Network traffic essentially refers to the amount and type of data moving across your network – this could be anything from user requests to data transfers. It’s the lifeblood of any digital environment, influencing the performance, security, and overall health of your network.
Note: Tools like cAdvisor have a handy selection of network metrics.
The role of DaemonSets in traffic monitoring
How do you keep an eye on this in a Kubernetes environment? This is where DaemonSets come into play.
As you already know, DaemonSets are a Kubernetes feature that allows you to deploy a pod on every node in your cluster.
Why is that important for network traffic monitoring?
Well, each node in your Kubernetes cluster can be involved in different kinds of network activities. By deploying a monitoring agent on every node, you get a comprehensive view of what’s happening across your entire cluster.
You might be wondering now:
Why not just use a Deployment and adjust the number of replicas to run on one or maybe two nodes to monitor the traffic of all nodes?
It sounds simpler, but here’s the catch:
1. Security and isolation: In Kubernetes, each node operates in its own isolated environment. This means that a pod on one node can’t directly monitor or access the network traffic of another node due to the security policies and Linux namespaces. These security measures are crucial for maintaining the integrity of your cluster.
2. Accurate and localized data: By having a monitoring agent on each node, you get precise, localized data about the traffic. This level of granularity is essential for effective monitoring, as it helps in identifying specific issues and bottlenecks that might occur on individual nodes.
3. Scalability and reliability: Using DaemonSets ensures that your monitoring setup scales with your cluster. As nodes are added or removed, the DaemonSet automatically adjusts, deploying or removing pods as needed. This dynamic scalability is a core requirement for maintaining a robust monitoring system in a growing or changing environment.
As you can see, using DaemonSets for network traffic monitoring in a Kubernetes cluster isn’t just a matter of convenience; it’s a necessity for accurate, secure, and scalable network analysis.
Each node has its own unique traffic patterns and potential issues, and DaemonSets ensure you don’t miss out on these critical insights. They empower you to maintain a high-performing and secure Kubernetes environment by providing a bird’s-eye view of your network traffic, node by node.
Simplifying network traffic monitoring in Kubernetes
When it comes to keeping tabs on network traffic in your Kubernetes cluster, the road can be complex and challenging.
Those keen on DIY approaches might consider building a custom solution. This could involve leveraging tools like `conntrack` to monitor each pod’s traffic, crafting intricate logic to process and store data, and continuously tackling a variety of potential issues that might arise along the way.
While this approach offers flexibility, it’s often resource-intensive and riddled with complexities.
A streamlined alternative to network monitoring
Alternatively, what if you could bypass these hurdles and jump straight to an efficient, ready-to-use solution?
That’s exactly what our open-source egressd tool offers. It’s designed to simplify network traffic monitoring in Kubernetes, providing a comprehensive and hassle-free approach.
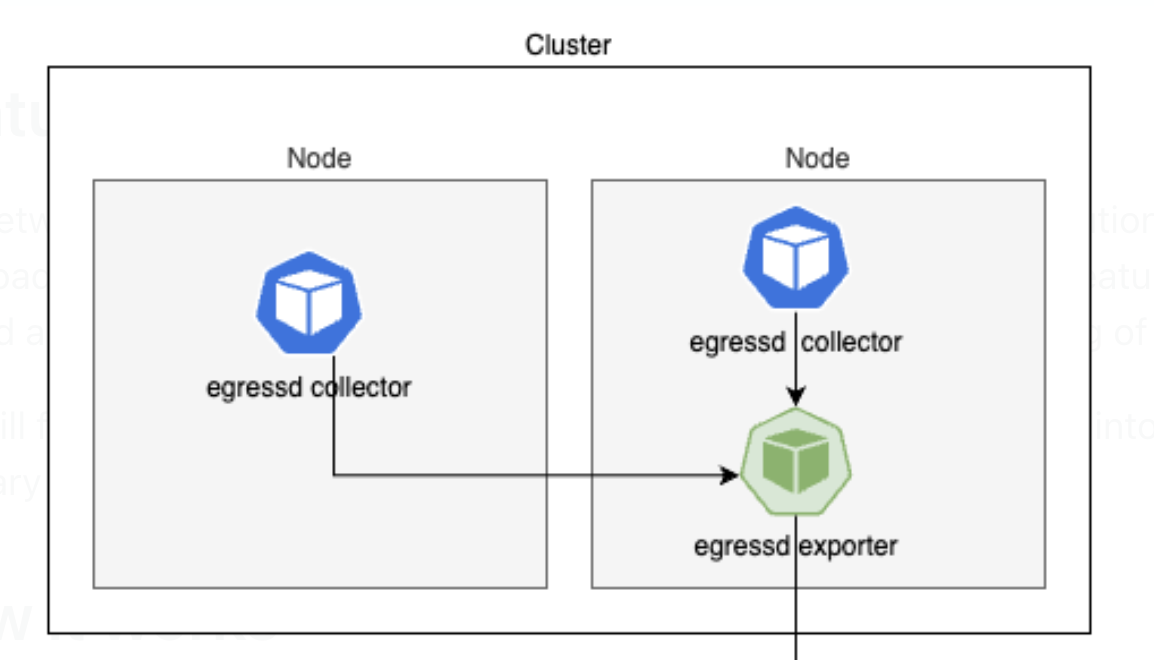
egressd consists of two main components:
- Collector – a DaemonSet pod responsible for monitoring network traffic on nodes.
- Exporter – a Deployment pod that fetches traffic data from each collector and export logs to HTTP or Prometheus.
Here’s what our solution brings to the table:
1. Efficient conntrack monitoring
egressd retrieves conntrack entries for pods on each node at a configured interval, defaulting to every 5 seconds.
If you’re using Cilium, it fetches conntrack records directly from eBPF maps located in the host’s `/sys/fs/bpf` directory, which are created by Cilium.
For setups using the Linux Netfilter Conntrack module, it leverages Netlink to obtain these records.
2. Intelligent data reduction
The records are then streamlined, focusing on key parameters like source IP, destination IP, and protocol to provide a clear picture of network interactions.
3. Enhanced with Kubernetes context
We enrich the data by adding Kubernetes-specific context. This includes information about source and destination pods, nodes, node zones, and IP addresses, giving you a comprehensive view of your cluster’s network traffic.
4. Flexible export options
The exporter in our solution is designed to be versatile, offering the capability to send logs either to an HTTP endpoint or to Prometheus for detailed analysis and alerting.
Sidestep the complexity of building and maintaining a custom solution with egressd
You get a solid, ready-to-deploy system that seamlessly integrates into your Kubernetes environment, providing detailed, real-time insights into your network traffic. This means you can focus more on strategic tasks and less on the intricacies of monitoring infrastructure.
Additionally, egressd provides you with two options:
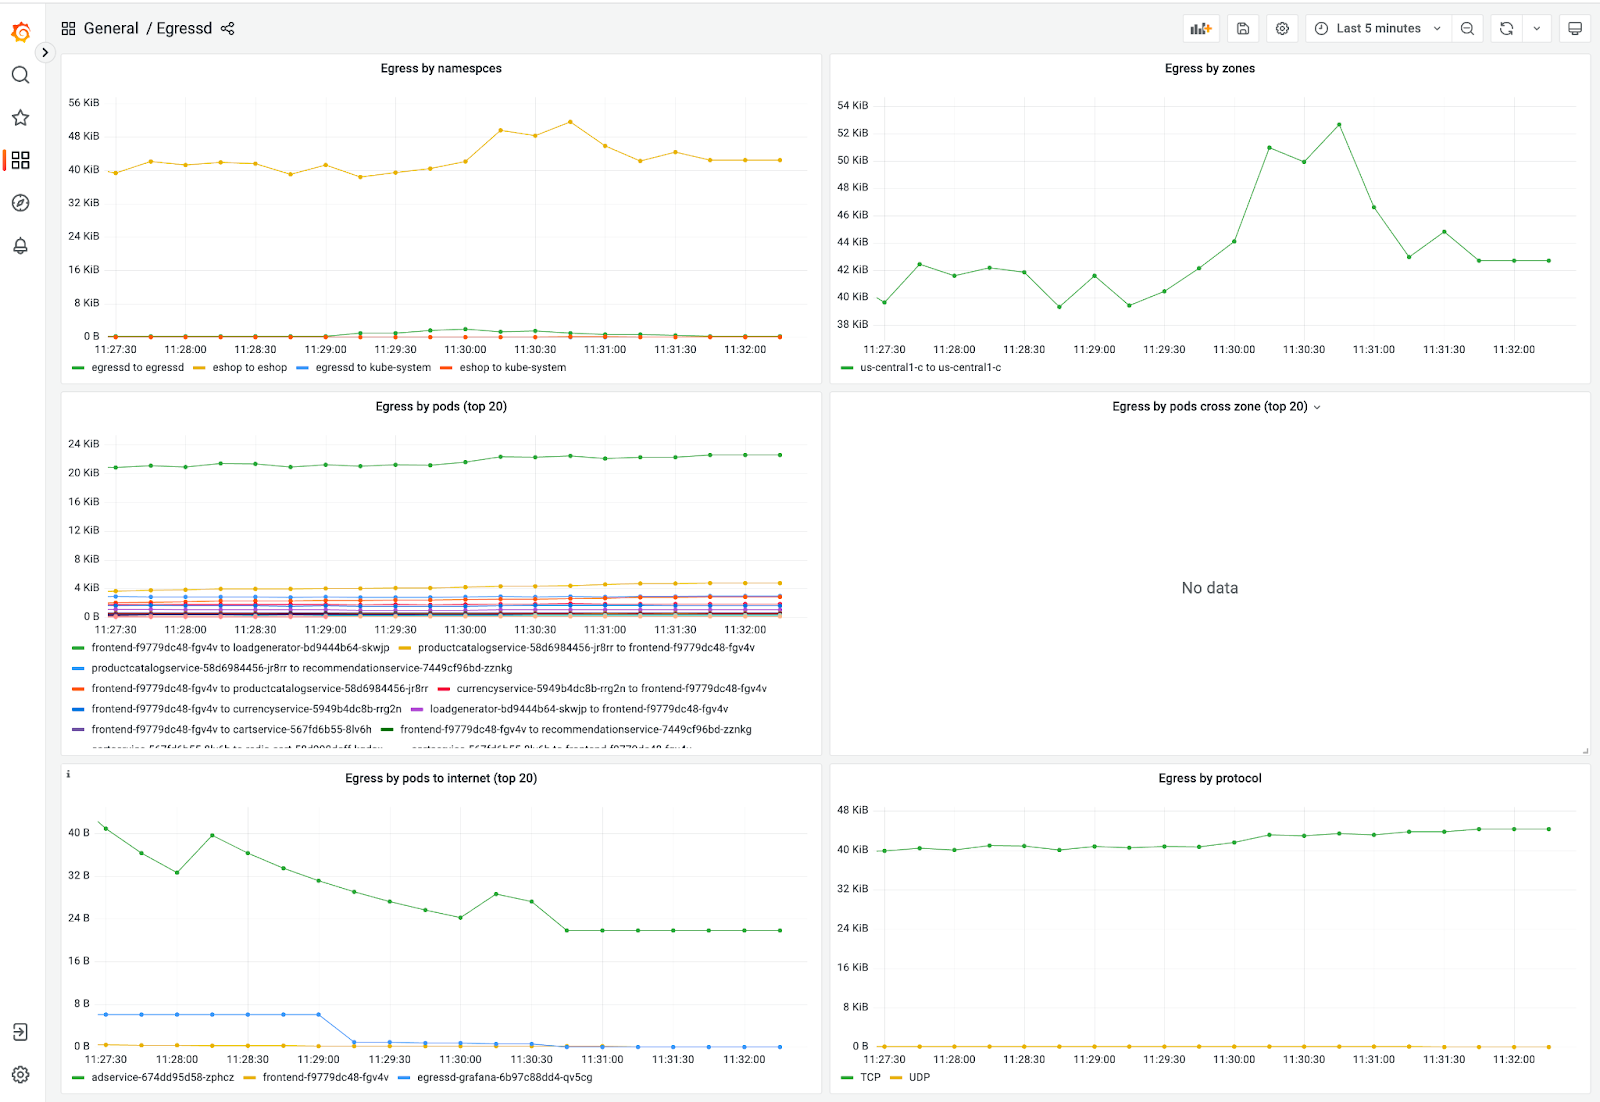
egressd can be installed as a standalone tool that will track your network traffic movements within the cluster, which you can then visualize in Grafana to get a better picture of your network:
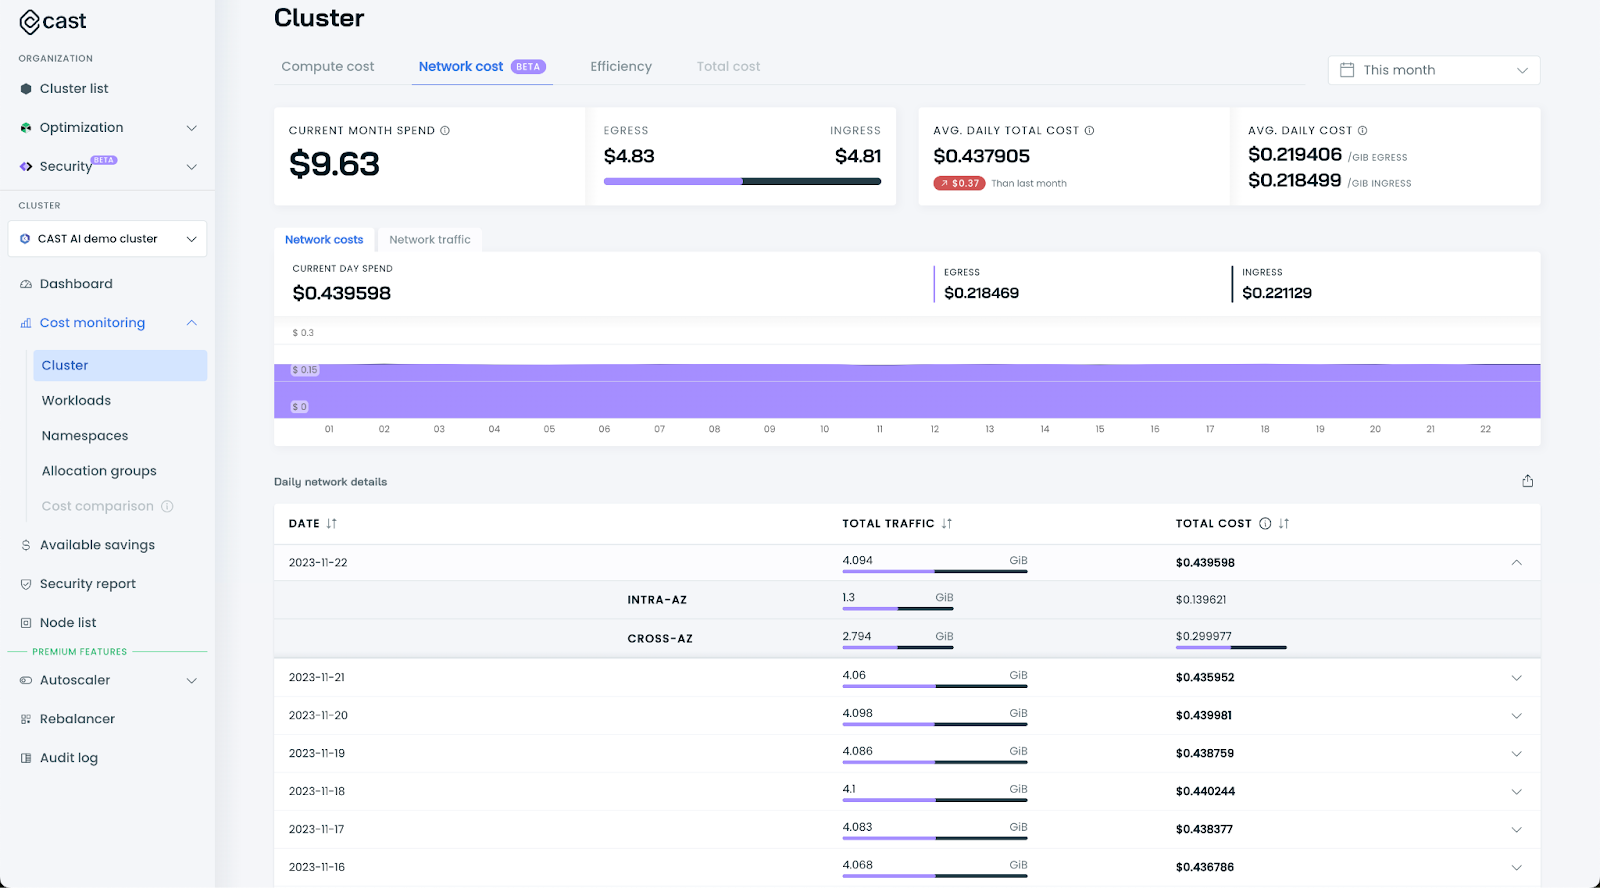
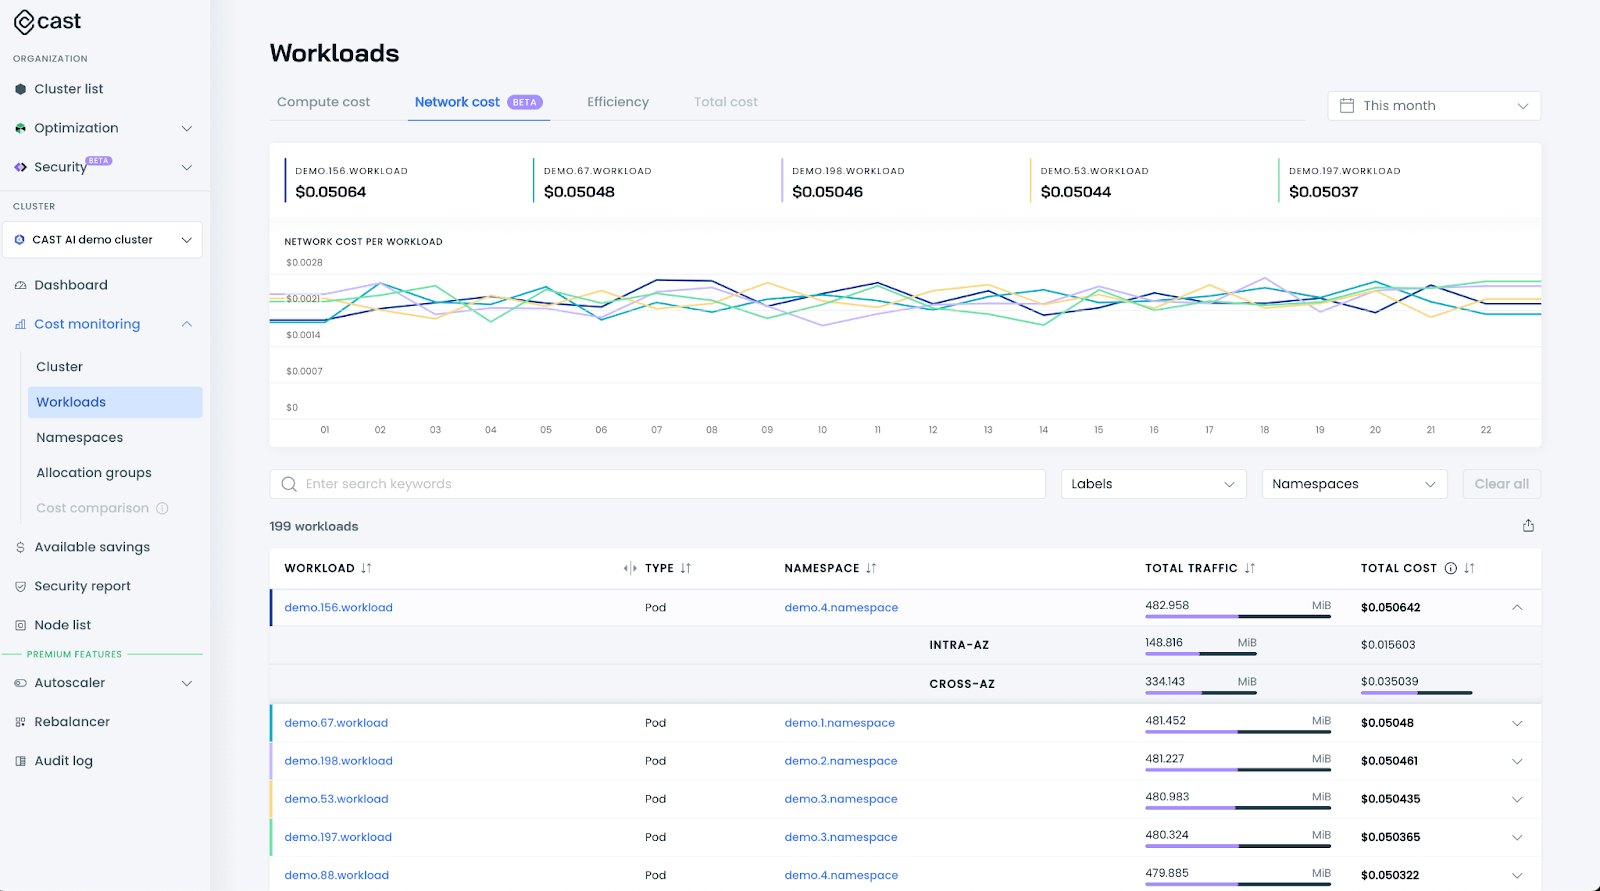
Alternatively, if you’re a CAST AI user, you can connect egressd to your dashboard to get all the benefits of our fancy cost reports.
This way, you can see not only the amount of traffic within the cluster but also get more insights about workload-to-workload communication – and how much you pay for that traffic as it differentiates between different providers/regions/zones.
Check out how we used the network cost report to reduce egress costs by 70%.
Wrap up
Kubernetes DaemonSets come in handy for logging and monitoring purposes, but this is just the tip of the iceberg. You can also use them to tighten your security and achieve compliance by running CIS Benchmarks on each node and deploying security agents like intrusion detection systems or vulnerability scanners to run on nodes that handle PCI and PII-compliant data.
And if you’re looking for more cost optimization opportunities, get started with a free cost monitoring report that has been fine-tuned to match the needs of Kubernetes teams:
- Breakdown of costs per cluster, workload, label, namespace, allocation group, and more.
- Workload efficiency metrics, with CPU and memory hours wasted per workload.
- Available savings report that shows how much you stand to save if you move your workloads to more cost-optimized nodes.


