Before the rise of cloud computing, engineers could only fantasize about provisioning infrastructure without consulting anyone from the business side. Today, they can set up a virtual instance in a matter of minutes without talking to anyone. That’s why building engineer awareness around cloud costs is so important – and a well-configured Grafana dashboard can help you do that.

Engineers aren’t used to factoring in expenses when they set up their cloud infrastructure, especially when they have so many other competing tasks to take care of. Counting on an in-depth cost-efficiency analysis just isn’t going to work.
Building a strong FinOps culture and motivating all cloud users to engage in cloud cost management is a critical step in cloud cost control.
Grafana, a monitoring and observability tool, can help you deal with it if you can find a method to include cost data in your Grafana dashboard.
Keep reading to find out why adding cost insights to Grafana is worthwhile and how to do it.
What are Grafana dashboards?
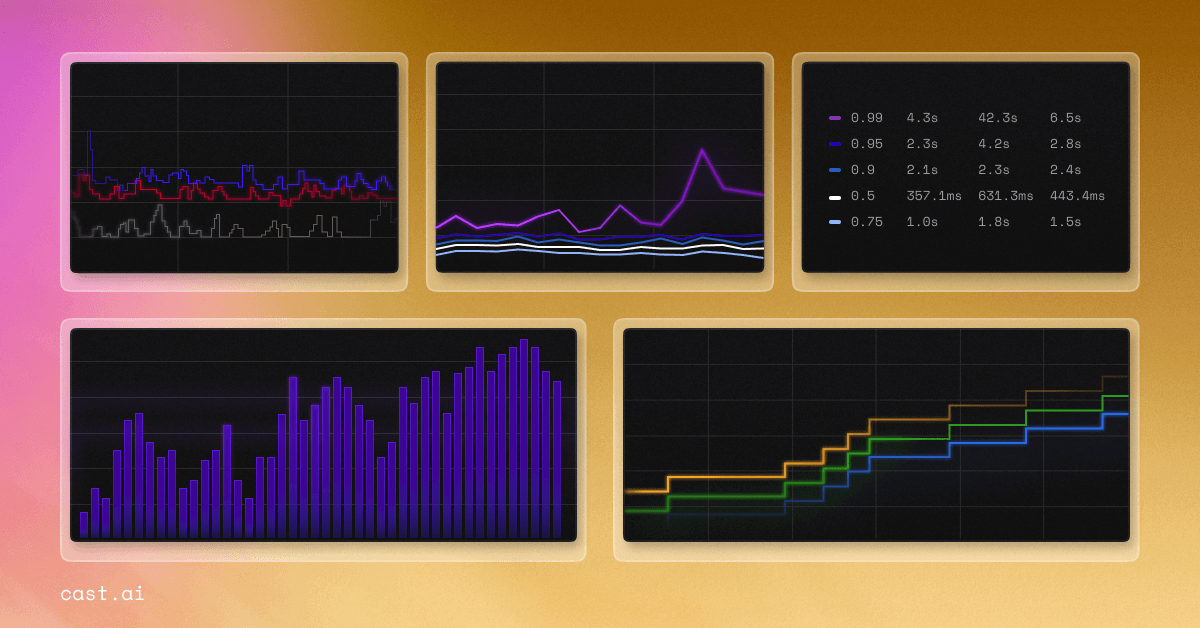
In Grafana, a dashboard helps you monitor different parts of your Kubernetes cluster, such as cluster CPU, pod CPU, memory, I/O, RX/TX, memory requests, limits, utilization, etc.
Creating modern Grafana dashboards for Kubernetes is easy. If you use Helm and the Helm chart functionality, it’s a matter of one Helm install command. There are several prebuilt Grafana templates for Kubernetes you can use, like prebuilt dashboards for ingress controllers, volumes, API servers, Prometheus analytics, and more.
Grafana dashboards are consolidated locations for monitoring real-time information. They are essential for Kubernetes monitoring – both for your apps and infrastructure. Kubernetes metrics in Grafana great total visibility into the condition of your Kubernetes cluster and guarantee that your services are performing as planned.
Grafana dashboards are used to monitor the following metrics:
- Kubernetes cluster resource consumption (cluster, node, pod, and container CPU/memory use)
- Kubernetes cluster nodes’ actual CPU/memory consumption
- Individual Kubernetes node health status
- Available resources for individual Kubernetes nodes
- Requested versus real resource usage
- Health and availability of pods
3 ways your Grafana dashboard can help control cloud costs
1. Check which workloads are costing you far too much money
One of the key challenges teams confront today is dealing with shared costs. This is particularly true in cloud-native settings such as Kubernetes.
However, a strong cost monitoring solution combined with Grafana provides a great source of insight that you can use for allocating costs to teams, departments, or projects.
CAST AI allows you to distribute cloud expenses at the namespace, label, and workload levels. You can simply combine Kubernetes cluster data with Grafana to create a useful dashboard that allows you to quickly examine the cost per job and attach it to a specific team.
This will come in handy when your workload costs start to spin out of control and you need to address the problem as soon as possible.
Here’s an example dashboard that includes CAST AI metrics:
2. Receive real-time alerts concerning price increases
Nobody has time to regularly monitor the infrastructure.
But what if a team member leaves a workload running for much too long? You may get an unexpected cloud charge of more than $500k like Adobe did. Or generate a massive cloud bill in a matter of hours, like the Silicon Valley startup Milkie Way did when they spent $72k testing Firebase and Cloud Run.
You can easily avoid this by adding a simple alert based on real-time utilization and cost data. Alert configuration seems like a simple step, but these examples show how impactful it can be.
If you find a way to include real-time cost data in your Grafana dashboard, you can specify usage/cost thresholds and receive alerts whenever the cost of your Kubernetes cluster exceeds them.
You’ll never be surprised when your cloud bill arrives at the end of the month, and your CFO will sleep better at night.
3. Raise cost awareness among your teams
According to the State of FinOps survey, getting engineers to act on cost optimization advice is a top FinOps-related challenge for over 40% of respondents, regardless of their maturity level.
By introducing cost indicators to Grafana, an industry-standard technology that most teams now use, you make them more accessible.
Engineers are already using Grafana for Kubernetes monitoring and observability. What’s another dashboard that shows them real-time Kubernetes cluster cost and utilization data?
You’re not asking people to switch context and work with another tool on top of the hundreds they’re currently using simply to figure out how much their Kubernetes cluster costs.
If you’re beginning to establish a FinOps culture at your organization, I shared some tips on how to convince your engineers that cloud cost control is crucial.
The best thing here is that bringing cost data to Grafana works like a shortcut.
Monitor your Kubernetes cluster costs with Grafana
At CAST AI, we developed the ability to move expense metrics from the CAST AI platform to Grafana via Prometheus.
Get started with a free cost monitoring report that has been fine-tuned to match the needs of Kubernetes teams – and then move all the data you need to Grafana. The Kubernetes monitoring module includes:
- Breakdown of costs per Kubernetes cluster, workload, label, namespace, allocation group, and more.
- Insights into network costs and network usage, including workload-to-workload communication.
- Workload efficiency metrics, with CPU and memory hours wasted per workload.
- Available savings report that shows how much you stand to save if you move your workloads to more cost-optimized nodes.
// get started
Optimize your cluster for free
Try powerful Kubernetes automation features combined with full cost visibility via cluster-specific savings reports and cost monitoring.
No card required
Unlimited clusters
Instant savings insights


Leave a reply