Discover the real GPU, CPU, and Memory utilization in Kubernetes applications across AWS, Azure, and Google Cloud Platform.
Based on the analysis of tens of thousands of Kubernetes clusters representing collectively millions of compute resources for CPUs, GPUs, memory, network, and storage, across AWS, GCP, and Azure. The report covers the full year 2025 and up to April 2026.
Introduction
Kubernetes has become the default orchestration layer for modern infrastructure, and by almost every measure – clusters deployed, workload diversity, geographic reach – adoption is accelerating. The question is no longer whether organizations will run Kubernetes, but rather how efficiently they will run it.
Our analysis of over tens of thousands of clusters across Amazon Web Services (AWS), Microsoft Azure, and Google Cloud Platform (GCP) suggests a clear answer: most are not, and the utilization gap is growing. Average CPU utilization fell to 8% in 2025, down from 10% the prior year, while memory utilization declined from 23% to 20%.
We also saw a newer pressure amplifying the problem: the rapid growth of GPU-equipped nodes as Kubernetes becomes the default platform for AI and ML workloads. GPU utilization tells a similar story, averaging just 5% across the clusters we analyzed. The pattern is consistent across cloud providers, cluster sizes, and industries.
This report examines where that waste concentrates, why it persists across organizations of every size and industry, and what it takes to close the gap.
Methodology
This report is based on our analysis of tens of thousands of Kubernetes clusters across AWS, GCP, and Azure, covering January 1 to December 31, 2025, and until April 2026 for GPU utilization. All utilization data was collected before these organizations enabled Cast AI’s automation features, providing a baseline of how clusters perform under typical conditions without automated optimization.
Pricing data is sourced from publicly available cloud provider APIs: the AWS Price List Query API, GCP Cloud Billing Pricing API, and Azure Retail Prices, sampled continuously at intervals of less than 60 seconds throughout the same period. For year-over-year comparisons, the same methodology was applied to 2025 and 2024 data from the prior year’s report.
This is the third year we’ve published this report. The numbers are worse.
CPU utilization fell to 8%, down from 10%. Memory dropped from 23% to 20%. GPU utilization across the clusters we analyzed: 5%. These are not survey responses or estimates1. They come from direct measurements of production clusters and millions of compute resources, before any optimization was applied.
The pattern holds: expanding Kubernetes footprints correlate with declining efficiency. This is not a new finding – it’s last year’s story, compounded. Organizations are committing more to infrastructure while returns, proportionally, continue to erode.
GPU waste deserves its own conversation because the economics are different. A CPU core sitting idle costs cents per hour. A GPU sitting idle costs dollars. And for the first time since EC2 launched in 2006, GPU prices are rising, not falling. In January 2026, AWS raised H200 Capacity Block prices by 15%, citing supply and demand. That broke a two-decade precedent.
At these prices, the hoarding instinct makes sense. Lead times are long, and releasing capacity you might not get back feels riskier than overpaying. I get it. But at 5% utilization, the math doesn’t work. And the hoarding feeds the scarcity loop that drives prices higher.
Spot Instance use for GPUs has been essentially nonexistent. That started to change early in 2026, but only at the low end. We started seeing T4s available on Spot, with some regions showing survival rates above 90% over 30 minutes. Whether this extends to higher-end GPUs or stays confined to the T4 tier, we’ll know in the next few quarters. I bet that it will not extend, considering that prices for H100/H200 are going up now (as of April 2026).
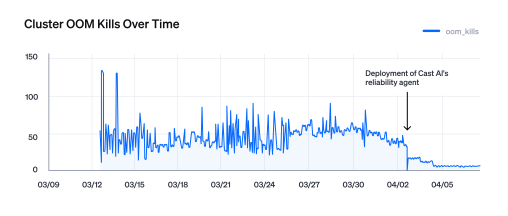
The data challenges another assumption I hear constantly: that you have to choose between cost and reliability. That overprovisioning is the price of SLO comfort. It isn’t. In one representative cluster, OOM kills averaged 40-50 per measurement interval despite generous resource padding. Automated rightsizing, which also cut provisioned CPUs by half, dropped OOM kills to near zero. The teams that stopped overprovisioning didn’t get less reliable – they got more reliable. The same mechanism that eliminates waste also catches the memory-starved workloads that humans miss.
One bright spot: ARM is showing up. About 9% of all CPUs are now ARM-based, growing at a rate 3.5 times that of x86. I thought it was a blip when we first reported it in 2024. It wasn’t. The trend held through all of 2025 and continues to accelerate.
The report shows where waste concentrates, why it persists, and what the organizations that closed the gap did differently. I hope it proves useful.
Laurent Gil Co-Founder and President of Cast AI
Key findings
The headline numbers from this year’s analysis confirm a trend that has been building for several years: Kubernetes environments are becoming less efficient as they scale, not more.
In the world of GPUs, several patterns explain why the gap persists
Spot adoption for GPU workloads remained negligible through most of 2025, with fewer than 2% of GPUs running on Spot Instances. Toward the end of the year, Spot availability began emerging for lower-end GPUs in select US regions, particularly us-east-2.
That trend has continued into early 2026. Survival rates for lower-end GPUs – Nvidia T4s in particular – have improved meaningfully in specific regions, though availability remains highly uneven across the broader region set.
ARM is outpacing x86, growing 3.5× faster since Q2 2024 – with no signs of slowing
Since Q2 2024, ARM has grown at 3.5× the rate of x86 – and hasn’t let up. It now accounts for 9% of the total CPU fleet, up from a near-negligible share just a year ago.
Part 1: The widening efficiency gap
CPU and Memory: The overprovisioning problem deepens
Year over year, the expectation is that overprovisioning will improve as cloud usage matures. The data suggests the opposite. Across all utilization dimensions, real utilization fell from 10% to 8% – meaning raw cloud waste increased by one-fifth in a single year.
Average CPU utilization across sampled clusters was 8% in 2025, down from 10% the prior year. Memory utilization fell from 23% to 20%. Both metrics are moving in the wrong direction.
8%
Average CPU utilization
20%
Average Memory utilization
As a secondary effect, the gap between provisioned capacity and what workloads actually request has also widened. This gap – the difference between what is allocated and what workloads ask for – is a critical measure of Kubernetes efficiency. CPU overprovisioning rose from 40% to 69% year over year. Memory overprovisioning stands at 79%. Organizations are paying for infrastructure that their workloads don’t even request, and the trend is accelerating.
The net effect is a feedback loop that compounds with scale. Every workload deployed with conservative resource requests adds headroom. Every autoscaler response adds nodes. The gap between capacity and consumption becomes structural rather than incidental.
Why does this gap exist?
Four structural factors explain why overprovisioning persists and grows with scale:
Teams over-specify resource requests as a defensive measure, padding CPU and memory requests to avoid throttling and OOM evictions, and the cost of that padding is invisible to the team responsible.
Inflated requests rarely get revisited after deployment because, without automated rightsizing, there is no systematic process to do so.
Resource definitions propagate through Helm charts and shared manifests, spreading conservative estimates across new deployments.
Cluster autoscalers respond to requests, not actual usage – when workloads request more than they consume, autoscalers provision nodes to match the inflated demand.
Organizations that apply automated rightsizing – continuously monitoring actual consumption and adjusting requests to match it – reduce their provisioned CPU footprint by approximately 50% on average once automation is in place. That connection is explored in Best Practice 1.
GPU utilization: Expensive capacity left idle
The average GPU utilization3 across the analyzed clusters was 5%. At that level, organizations have roughly 20 times as much GPU capacity as their workloads consume at any given moment.
The financial context matters here in a way it doesn’t for CPU underutilization. Given the premium cost of GPU instances, this level of waste carries a far heavier financial impact than CPU and memory underutilization – and, unlike CPU headroom, idle GPU capacity is rarely cheap to spare.
5%
Average GPU utilization
Utilization by the cloud provider
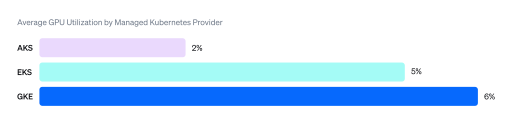
GPU utilization varied across managed Kubernetes services, though it remained low across all three providers, and the difference is not statistically significant.
Across all three providers, the conclusion is consistent: the overwhelming majority of provisioned GPU capacity sits idle
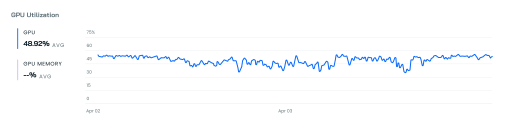
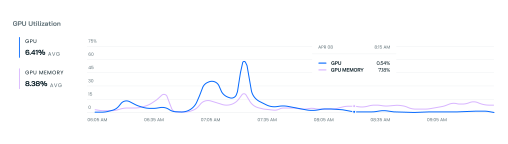
The average GPU utilization remains low across the fleet, though there are exceptions. One organization reached 49% on H200s and 30% on H100s – well above average. The more telling signal is intra-day variance: utilization swings widely, suggesting provisioning is sized for peak demand rather than typical load. Also, utilization varies between weekdays and weekends. GPU sharing, despite being well understood among MLOps engineers, is nearly absent in practice.
What does good optimization look like? Here’s a single cluster of 136 H200s sustaining 49% utilization:
Part 2: Why the gap persists
Spot adoption: A problem with a large price tag
Only 2% of GPUs run on Spot Instances – a figure that reflects, in part, a straightforward availability problem. For most GPU types, Spot capacity has simply not been available. That is beginning to change: early 2026 data shows meaningful Spot availability for lower-end GPUs, particularly T4s, where the gap between on-demand and interruptible pricing now represents a significant unrealized cost saving.
Beyond availability, the reluctance is understandable. GPU workloads are typically long-running and sensitive to interruption, and the prospect of a Spot Instance being reclaimed mid-execution is enough to deter most teams. But interruption risk is highly variable – and much of it is manageable through placement decisions.
Reliability varies across cloud regions and is now manageable
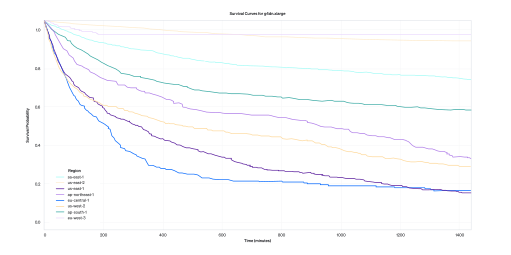
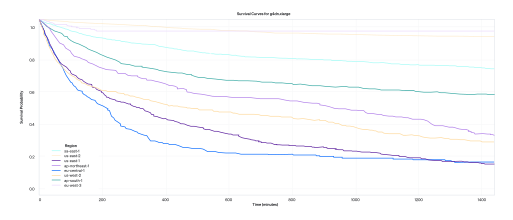
Spot Instance survival curves for NVIDIA T4 Tensor Core (AWS g4dn.xlarge) instances show how long instances run uninterrupted across 8 regions.
The region eu-west-3 maintains a survival probability above 0.9 for the full 24-hour window. At the other extreme, eu-central-1 and us-east-1 drop below 0.2 by the end of the same window – meaning instances in those regions have roughly an 80% chance of being interrupted within a day.
Still, and even for T4s, the most striking takeaway is the enormous variance between regions. eu-west-3 stands out as the most stable region, maintaining a survival probability above 0.9 for the full 24 hours. At the other extreme, eu-central-1 and us-east-1 are the most volatile, with survival probabilities dropping below 0.2 by the end of the observation window – meaning instances in those regions have roughly an 80% chance of being interrupted within a day.
Region selection is not just a latency and compliance decision. For teams running GPU workloads on Spot Instances, it’s a reliability decision with measurable consequences. The same instance type, in a better region, can mean the difference between a training run that completes reliably and one that requires constant recovery.
Pricing varies by 2x to 5x across cloud regions
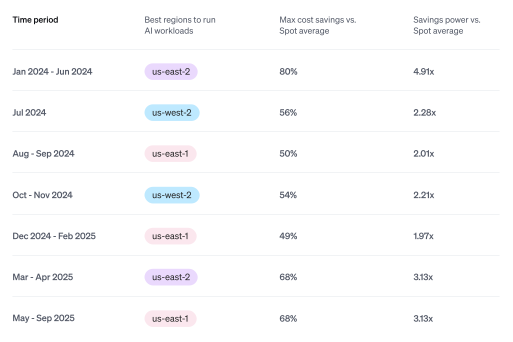
By selecting the most favorable US region in each period, teams could achieve savings ranging from 2x to nearly 5x compared to average Spot Instance prices. A team willing to shift workloads based on market conditions could reduce GPU compute costs by 50% to 80%, with the most favorable periods yielding close to five times the efficiency of average regional pricing.
p4d.24xlarge (A100)
No team can realistically monitor Spot pricing and availability across every region and availability zone in real time. This is where automation creates practical value: continuously evaluating market conditions, selecting optimal placement, handling interruptions gracefully, and falling back to on-demand capacity when needed.
The rise of ARM in Kubernetes: Trading architecture for efficiency
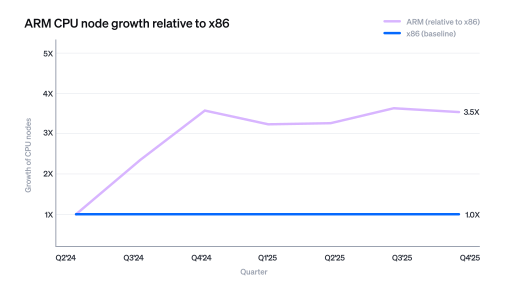
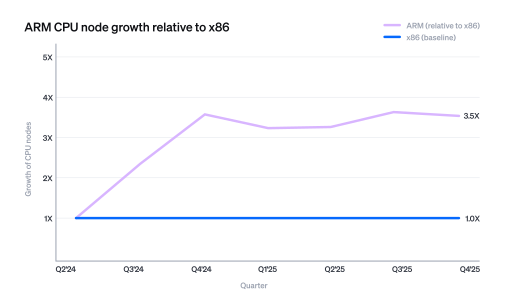
ARM CPU nodes grew at a rate 3.5 times that of x86 between Q2 2024 and Q4 2025. This is not a marginal preference shift – it’s a structural change in how teams are provisioning compute for Kubernetes workloads. The gap widens every quarter.
The driver is economics. ARM instances like AWS Graviton deliver better price-to-performance for the workloads that dominate Kubernetes fleets: containerized stateless services, API servers, and CPU-bound event-driven processors that are not dependent on x86-specific instruction sets.
For these workloads, teams see meaningful reductions in per-core cost without sacrificing throughput. As Kubernetes adoption scales and infrastructure bills follow, the incentive to re-evaluate the default x86 choice becomes hard to ignore.
ARM’s efficiency gains compound with the techniques that already work well on stateless workloads – bin-packing, rightsizing, and Spot scheduling all become more effective when the underlying compute is cheaper per core.
A team that rightsizes a stateless deployment and runs it on Graviton is capturing savings on two axes simultaneously. The 3.5x growth in ARM nodes suggests that more teams have worked out this compounding effect and are acting on it, rather than treating compute architecture as a fixed constraint.
Stateful workloads: The optimization opportunity teams haven’t unlocked yet
Despite years of ecosystem investment in tools such as StatefulSets, persistent volume claims, and database and message-queue operators, stateful workload adoption is still very low.
In 2024, stateful workloads accounted for 8% of all observed deployments. By 2025, that share is at the same level.
This composition has direct consequences for resource optimization. Stateful workloads present multiple challenges: storage I/O constraints limit bin-packing, persistent volume attachments complicate node consolidation, and the risk of disrupting in-flight transactions makes autoscaling conservative by necessity.
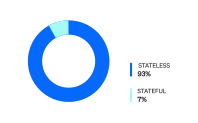
A fleet that is 93% stateless is, from an optimization standpoint, a fleet operating largely in the tractable zone. The challenge is that the 7% or 8% stateful share, while small in count, tends to anchor the largest and most resource-intensive workloads – databases, message brokers, caches – meaning their disproportionate footprint makes them harder to ignore even as their share of deployment count stays flat.
Part 3: Six best practices to close the utilization gap
The data in this report describes a few efficiency problems. The following sections cover each one – what it costs to leave it unaddressed, and what effective solutions look like in practice, grounded in examples from organizations that have already closed the gap.
1. Rightsize Kubernetes workloads automatically
Most teams overprovision CPU and memory requests as a safety margin – better to allocate more than to risk throttling or OOM evictions. The problem is that these configurations rarely get updated after initial deployment. What starts as a reasonable buffer becomes the permanent baseline, replicated across environments through Helm charts that were never designed to be environment-specific.
Automated rightsizing solutions continuously analyze actual resource consumption patterns and recommend or apply adjustments to resource requests and limits. By adopting these tools, teams can reclaim unused capacity, improve cluster utilization, and reduce spending – all without sacrificing application performance or reliability.
Organizations that apply automated rightsizing reduce their provisioned CPU footprint by approximately 50%.
Real-life example: Mercedes-Benz.io
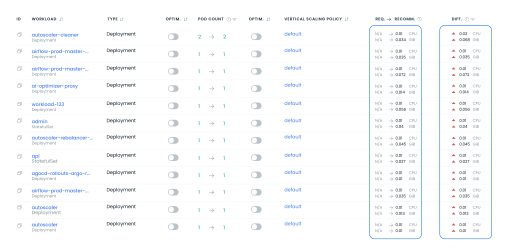
Mercedes-Benz.io faced several scaling and efficiency challenges in the Kubernetes environment. Workloads that were not rightsized led to unnecessary resource consumption, and the use of outdated instance types prevented the team from realizing the performance and cost benefits of newer generations. The large scale of Mercedes-Benz.io’s Kubernetes footprint only amplified these inefficiencies, resulting in significant operational overhead and cost.
Mercedes-Benz.io used automation to scale workload requests up and down to dramatically improve resource utilization – as displayed on this image:
The reliability dividend: Why rightsizing eliminates OOM kills
The most counterintuitive finding from automated rightsizing is its effect on reliability. Teams overprovision resources precisely to avoid Out-of-Memory (OOM) kills – the assumption being that more headroom means fewer crashes. But static overprovisioning is a blunt instrument. It adds capacity uniformly, including to workloads that don’t need it, while leaving others – the ones with genuinely growing memory footprints – set to limits that were last reviewed at deployment time.
Automated rightsizing agents work in both directions. They reduce requests for workloads that consume far less than their allocated capacity, and they increase requests for workloads approaching or exceeding their limits. That second adjustment eliminates OOM kills: the agent identifies workloads under memory pressure and increases their requests before the kernel intervenes.
The graph below illustrates this effect. Before the deployment of Cast AI’s workload rightsizing agent, this cluster averaged 40-50 OOM kills per measurement interval, with regular spikes above 80. Within days of activation, OOM kills dropped to near zero and stayed there.
The implication is practical: teams don’t need to choose between efficiency and reliability. Automated rightsizing delivers both simultaneously, because the same mechanism that eliminates waste also eliminates the blind spots that cause crashes.
2. Use the right node autoscaler
The native Kubernetes Cluster Autoscaler is reactive by design – it only provisions new nodes after pods are already pending, introducing delays that can hurt performance during traffic spikes. It’s also constrained by predefined node groups, often selecting instances larger than what workloads actually need, and its limited bin-packing can leave nodes underutilized yet not idle enough to scale down.
These inefficiencies are why alternative autoscalers like Karpenter have gained traction – they provision right-sized instances based on pending pod requirements, enabling faster scheduling and better cost optimization.
The overprovisioning gap is partly a consequence of how autoscalers work. The native Cluster Autoscaler and Karpenter will provision nodes based on requested resources, not actual usage. When workloads over-request, the autoscaler treats that as genuine demand and adds nodes, deepening the gap.
Real-life example: Caudalie
Caudalie had already implemented extensive cost and performance optimizations, but increasing operational overhead led them to seek an automation solution to streamline cluster management and uncover additional efficiency gains. In particular, they needed autoscaling that could handle traffic fluctuations.
Caudalie used an autoscaling solution that provisions capacity in line with demand, eliminating cloud waste. The image below shows the autoscaler’s impact around the eighth day of the visualized month, where a significant drop can be noted:
3. Automate Spot Instance management
Spot Instances offer significant cost savings compared to on-demand pricing, but their ephemeral nature and the possibility of interruption at short notice make manual management impractical and risky. The key challenge is not just handling interruptions – it’s making the right placement decisions continuously: across instance types, availability zones, and regions, and faster than cloud market conditions change.
Automation handles the complexity that prevents most teams from adopting Spot: selecting from diverse instance pools to reduce interruption risk, diversifying placement across availability zones, monitoring market conditions in real time, and falling back to on-demand when availability drops below the threshold required by workloads.
Real-life example: Iterable
As an advanced Kubernetes user, Iterable was looking for a solution to automatically manage cloud resources while optimizing costs.
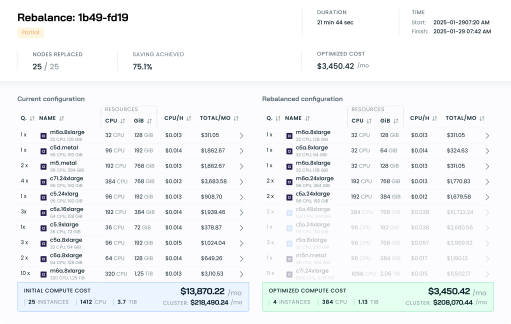
The team set up their solution to run an hourly rebalancing of Spot Instances. During rebalancing, suboptimal nodes are automatically replaced with new, more cost-efficient nodes that use the most up-to-date Node Configuration settings.
As a result, around 2000 CPUs get removed, reducing the number of nodes by 10% and generating significant savings. During low-demand periods like nighttime, rebalancing can achieve even 100% savings by draining and removing the nodes altogether.
4. Maximize GPU utilization through time-slicing and intelligent scheduling
The standard deployment model for GPU workloads assigns each model its own dedicated instance. This makes sense when workloads saturate the GPU continuously – but most serving workloads do not. Inference endpoints see highly variable request rates with extended idle periods between bursts. On a dedicated instance, every idle second costs the same as a second of full utilization.
Methods like GPU sharing, MIG, and time-slicing address this by allowing multiple models to share a single GPU instance, allocating access in time slices or memory slices rather than assigning exclusive ownership. When combined with bin-packing – the automated selection and placement of workloads across fewer, right-sized nodes – and a Spot split for production workloads, the efficiency gains compound at each layer.
Fleet-wide average GPU utilization is 5%. GPU sharing and intelligent scheduling can materially close this gap.
Real-world example: ALLEN Digital
ALLEN Digital runs an AI-powered e-learning platform that uses machine learning to respond to student queries submitted as images and text. Their infrastructure included seven deployed models: three open-source (BGE-M3, LlamaGuard, and Multilingual E5 Large) and four custom-built models.
The team had originally deployed on Amazon SageMaker. As the platform scaled, GPU instances ran continuously but served intermittent request loads, paying for dedicated capacity that spent most of its time idle. Other infrastructure alternatives reduced costs but degraded latency or performance to unacceptable levels.
After discovering Cast AI’s Kimchi through their existing EKS optimization work, ALLEN Digital deployed all seven models using GPU time-slicing, allowing multiple models to share the same GPU instance. They also configured a 50/50 split between on-demand and Spot Instances for production workloads, keeping half their capacity on reliable on-demand and capturing Spot savings on the other half. Node bin-packing further optimized placement, automatically consolidating workloads onto fewer, right-sized nodes.
The optimization was iterative. Initial GPU time-slicing produced 20% savings immediately. Consolidating models onto shared instances with time-slicing increased that to 30-40%.
Analyzing CPU and memory utilization and reducing overallocation enabled smaller node sizes, pushing total savings past 70% compared to SageMaker. Latency held throughout.
If your models are underutilized, or if you’re trying to achieve higher utilization and fully leverage GPU capacity while reducing costs, I think Kimchi is a great solution. It allows you to achieve time-slicing configurations for your models. Since most models can be containerized now, this is definitely worth exploring.
Karthik Bhat DevOps Engineer at ALLEN Digital
What automated GPU sharing looks like in practice
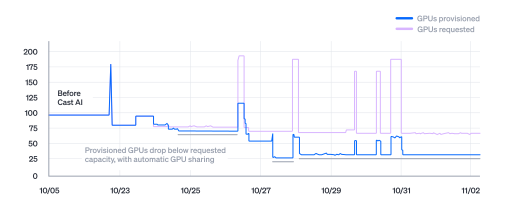
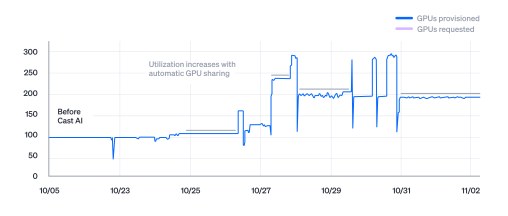
The graphs below show the before-and-after impact of enabling automated GPU sharing on a production cluster.
Before activation, the number of provisioned GPUs matched the number of requested GPUs one-to-one – the standard dedicated-instance model where each workload gets exclusive access to its GPU. After enabling automated GPU sharing, two things happened simultaneously:
First, provisioned GPUs dropped well below requested GPUs. The cluster went from provisioning roughly 100 GPUs to serving |the same (and growing) workload demand with 25 to 75 physical GPUs. Multiple workloads now share the same GPU hardware, and the scheduler places them based on actual compute and memory needs rather than assigning exclusive ownership.
Second, GPU utilization increased from a flat baseline of around 100% on the dedicated fleet to 200–300% across the shared fleet. The remaining GPUs are doing real work rather than sitting idle between requests.
The pattern confirms the economics described earlier: most GPU workloads don’t continuously saturate their hardware. Automated sharing reclaims that idle capacity without requiring teams to manually profile workloads, select sharing ratios, or manage scheduling conflicts. The system continuously evaluates resource consumption, places multiple workloads on the same GPU when utilization allows, and adjusts as demand changes.
This is an example where GPU sharing will be very useful:
5. Automate node lifecycle management
Keeping nodes up to date is not optional – unpatched nodes carry a security risk. But manually upgrading nodes across large or multi-cluster environments requires cordoning, draining, and replacing nodes one by one while ensuring workloads remain available throughout the process. In environments with stateful workloads, this is a slow, careful, high-attention task that scales poorly.
Automated upgrade strategies handle this lifecycle systematically: identifying nodes that require updates, sequencing the process to respect disruption budgets, replacing outdated nodes with minimal impact on workload, and maintaining an audit trail documenting what was changed and when. For organizations in regulated industries, the audit capability has value that extends well beyond operational convenience.
Manual node lifecycle management is unsustainable at this composition. Automated upgrade strategies with workload-aware sequencing remove this ceiling.
Real-life example: InCred Finance
Reliability and scalability have always been critical at InCred Finance, a cloud-native financial services organization. The team needed an automation solution that would streamline operations, especially around regular upgrades.
Kubernetes upgrades are generally hard. In the past, when we had to do an upgrade, we had to think about creating node groups, node templates, the latest AMIs available in the market – all of that. With Cast, that’s no longer a concern.
[…] Being in the financial sector, patching and updating our servers is a top priority. Cast has made that process significantly easier. We don’t have to worry about how I’m going to handle patching anymore; it’s all handled automatically in the background.
And what’s really helpful is that it’s all demonstrable. We can go into the Cast console and, at any point, show an external auditor exactly what’s been set up and what actions have been taken. There’s a clear audit trail, and that gives me a lot more peace of mind.
Dheeraj Arani Head – Cloud Infra, DevOps & SRE at InCred Group
6. Maximize the value of cloud commitments
Reserved Instances and Savings Plans require upfront commitment to specific usage profiles. When actual usage drifts – because workloads change, traffic patterns shift, or new services are added – the alignment between committed and consumed capacity degrades. Over-committing ties up budgeted capacity. Under-committing leaves savings unrealized. Tracking this balance manually is not a one-time task; it is a continuous one.
Automated commitment management continuously monitors utilization against committed capacity and adjusts the split between committed and on-demand spend to maintain an optimal balance – without the ongoing analysis required to achieve it manually.
Organizations running large Kubernetes footprints typically carry a mix of committed and on-demand compute spend. Maintaining that alignment manually across multiple accounts, regions, and instance families is a continuous, error-prone process.
Real-life example: ShareChat
ShareChat used resource-based Committed Use Discounts to optimize the costs for steady workloads. To benefit from the discounts, team members spent a lot of time figuring out which percentage of a given cluster could run on discounted resources. This is where automation made a difference.
We had to tweak the setup a lot to get to the sweet spot. This became inefficient because you cannot drive synergies across clusters of different sizes when they leverage different families simultaneously. Another question was whether it could be run cost-effectively at night, when we have much lower traffic. In some of our commitments, we wasted up to 35% of resources that were already paid for.
[…] Now, I don’t have to do anything manually and we’re close to 98% commitment utilization. I used to do capacity planning twice a week for CUD management – now I do that once every two months.
Abhiroop Soni Staff Engineer – DevOps at ShareChat
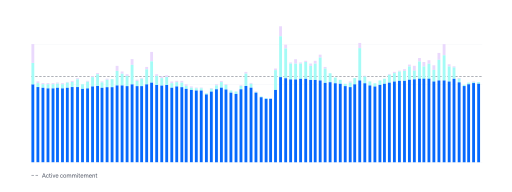
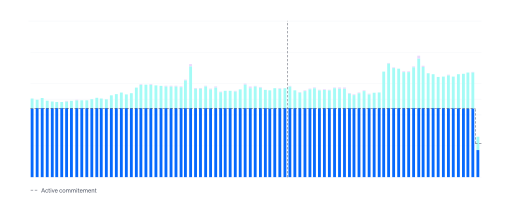
The image below shows the period before optimization where resource utilization would often fail to reach the line marking committed capacity:
After implementing Cast, capacity utilization increased to around 98%:
Conclusion
The dataset tells a consistent story: Kubernetes adoption is growing, and Kubernetes efficiency is declining in proportion to that growth. CPU overprovisioning gets worse year over year. Utilization fell across CPU, memory, and GPU. The efficiency gains that Kubernetes was supposed to deliver are not emerging naturally with scale – they require deliberate, continuous effort to realize.
Three compounding factors make this harder over time. GPU adoption is deepening the problem because accelerated compute is more expensive to leave idle and more difficult to rightsize without purpose-built tooling. And the organizations adding Kubernetes clusters fastest tend to be the same ones with the least optimization tooling in place – meaning the problem scales with the very momentum of Kubernetes adoption.
The organizations in this report that closed the gap share a common characteristic: they stopped treating resource efficiency as a manual, one-time configuration task and started treating it as an automated, continuous process.
Rightsizing that runs once at deployment is not rightsizing – workloads change, traffic patterns shift, and the configuration that was accurate six months ago is unlikely to remain so today. The same is true of Spot Instance selection, autoscaler configuration, commitment utilization, and node lifecycle management. Each has a time dimension that manual processes cannot keep up with at scale.
The efficient Kubernetes cluster is not a configuration. It is a feedback loop.
The GPU utilization is an accurate measurement of enterprise Kubernetes clusters with mixed development/staging/production, measured as “percentage of total provisioned GPU compute cycles that produce useful output across a 24-hour period”. Clusters from AI Labs are not included in the statistics as AI Labs have usually a very intense use of GPUs for training and inference. ↩︎
The GPU utilization is an accurate measurement of enterprise Kubernetes clusters with mixed development/staging/production, measured as “percentage of total provisioned GPU compute cycles that produce useful output across a 24-hour period.” Clusters from AI Labs are not included in the statistics, as AI Labs usually have a very intense use of GPUs for training and inference. ↩︎
The GPU utilization is an accurate measurement of enterprise Kubernetes clusters with mixed development/staging/production, measured as “percentage of total provisioned GPU compute cycles that produce useful output across a 24-hour period.” Clusters from AI Labs are not included in the statistics, as AI Labs usually have a very intense use of GPUs for training and inference. ↩︎