Autoscaling is a core capability of Kubernetes. The tighter you configure the scaling mechanisms – HPA, VPA, and Cluster Autoscaler – the lower the waste and costs of running your application.
Kubernetes comes with three types of autoscaling mechanisms: Horizontal Pod Autoscaler (HPA), Vertical Pod Autoscaler (VPA), and Cluster Autoscaler. Each of these adds a unique ingredient to your overarching goal of autoscaling for cloud cost optimization.
In this article, we focus on horizontal pod autoscaling. You can control how many pods run based on various metrics by configuring the Horizontal Pod Autoscaler (HPA) settings on your cluster. This gives you the ability to scale up or down according to demand.
Keep reading to learn what Kubernetes HPA is and how it works in a hands-on example.
Let’s start with a quick recap of Kubernetes autoscaling
Before diving into Horizontal Pod Autoscaler (HPA), let’s look at Kubernetes autoscaling mechanisms.
Kubernetes supports three types of autoscaling:
- Horizontal Pod Autoscaler (HPA), which scales the number of replicas of an application.
- Vertical Pod Autoscaler (VPA), which scales the resource requests and limits of a container.
- Cluster Autoscaler, which adjusts the number of nodes of a cluster.
These autoscalers work on one of two Kubernetes levels: pod and cluster. While Kubernetes HPA and VPA methods adjust resources at the pod level, the Cluster Autoscaler scales up or down the number of nodes in a cluster.
At CAST AI, we made sure that our platform works really well with HPA and offers a direct replacement for Cluster Autoscaler. For more advanced horizontal scaling and business metrics-centric scaling, check out KEDA.
What is Kubernetes Horizontal Pod Autoscaler (HPA)?
In many applications, usage changes over time – for example, more people visit an e-commerce store in the evening than around noon. When the demands of your application change, you can use the Horizontal Pod Autoscaler (HPA) to add or remove pods automatically based on CPU utilization.
HPA makes autoscaling decisions based on metrics that you provide externally or custom metrics.
To get started, you need to define how many replicas should run at any given time using the MIN and MAX values. Once configured, the Horizontal Pod Autoscaler controller takes care of checking metrics and making adjustments as necessary. It checks metrics every 15 seconds by default.
How does Horizontal Pod Autoscaler work?
Configuring the HPA controller will monitor your deployment’s pods and understand whether the number of pod replicas needs to change. To determine this, HPA takes a weighted mean of a per-pod metric value and calculates whether removing or adding replicas would bring that value closer to its target value.
Example scenario
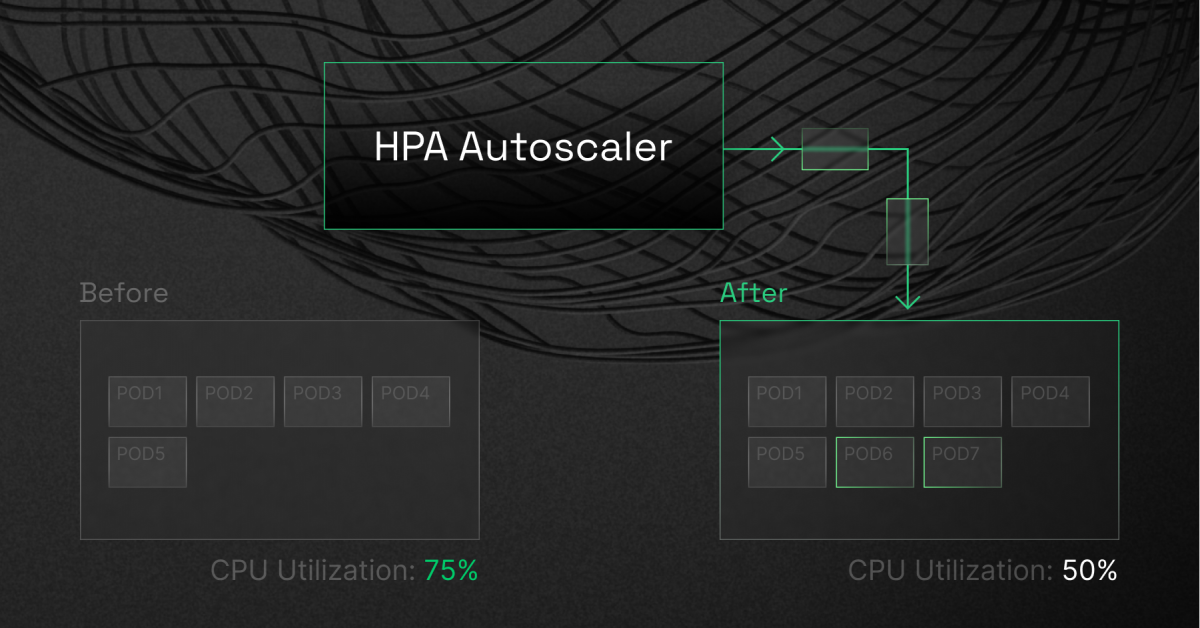
Imagine that your deployment has a target CPU utilization of 50%. You currently have five pods running there, and the mean CPU utilization is 75%. In this scenario, the HPA controller will add three replicas to bring the pod average closer to the target of 50%.
When to use Kubernetes HPA?
Horizontal Pod Autoscaler is an autoscaling mechanism that comes in handy for scaling stateless applications. But you can also use it to support scaling stateful sets.
To achieve cost savings for workloads that experience regular changes in demand, use HPA in combination with cluster autoscaling. This will help you reduce the number of active nodes when the number of pods decreases.
Limitations of Horizontal Pod Autoscaler
Note that HPA comes with some limitations:
- It might require architecting your application with a scale-out in mind so that distributing workloads across multiple servers is possible.
- HPA might not always keep up with unexpected demand peaks since new virtual machines may take a few minutes to load.
- If you fail to set CPU and memory limits on your pods, they may frequently terminate or waste resources if you choose to do the opposite.
- If the cluster is out of capacity, HPA cannot scale up until new nodes are added to the cluster. Cluster Autoscaler (CA) can automate this process.
What do you need to run Horizontal Pod Autoscaler?
Horizontal Pod Autoscaler (HPA) is a feature of the Kubernetes cluster manager that watches the CPU usage of pod containers, automatically resizing them as necessary to maintain a target level of utilization.
To do that, HPA requires a source of metrics. For example, when scaling based on CPU usage, it uses metrics-server. If you want to use custom or external metrics for HPA scaling, you need to deploy a service implementing the custom.metrics.k8s.io API or external.metrics.k8s.io API; this provides an interface with a monitoring service or metrics source.
Custom metrics include network traffic, memory, or any value that relates to the pod’s application. And if your workloads use the standard CPU metric, make sure to configure the CPU resource limits for containers in the pod spec.
Expert tips for running Kubernetes HPA
1. Install metrics-server
Kubernetes HPA needs to access per-pod resource metrics to make scaling decisions. These values are retrieved from the metrics.k8s.io API provided by the metrics-server.
2. Configure resource requests for all pods
Another key source of information for HPA’s scaling decisions is observed CPU utilization values of pods. But how are these values calculated? They are a percentage of the resource requests from individual pods.
If you miss resource request values for some containers, these calculations might become entirely inaccurate and lead to suboptimal operation and poor scaling decisions. That’s why it’s worth configuring resource request values for all containers of every pod that’s part of the Kubernetes controller scaled by the HPA.
3. Configure custom and external metrics
Custom metrics
You can configure Horizontal Pod Autoscaler (HPA) to scale based on custom metrics, which are internal metrics that you collect from your application. HPA supports two types of custom metrics:
- Pod metrics – averaged across all the pods in an application, which support only the target type of AverageValue.
- Object metrics – metrics describing any other object in the same namespace as your application and supporting target types of Value and AverageValue.
Remember to use the correct target type for pod and object metrics when configuring custom metrics.
External metrics
These metrics allow HPA to autoscale applications based on metrics that are provided by third-party monitoring systems. External metrics support target types of Value and AverageValue.
When deciding between custom and external metrics, go for custom metrics because securing an external metrics API is more difficult than getting an internal one.
4. Verify that your HPA and VPA policies don’t clash
Vertical Pod Autoscaler automates requests and limits configuration, reducing overhead and achieving cost savings. Horizontal Pod Autoscaler, on the other hand, aims to scale out rather than up or down.
Double-check that your binning and packing density settings aren’t in conflict with each other when designing clusters for business or purpose-class tier of service.
5. Use instance weighting scores
Suppose one of your workloads ends up consuming more than it requested. Is this happening because the resources are needed? Or did the workload consume them because they were available but not critically required?
Use instance weighting when choosing instance sizes and types for autoscaling. Instance weighting is useful, especially when you adopt a diversified allocation strategy and use spot instances.
Example: HPA demo
As this is one of core Kubernetes features, the cloud service provider we use shouldn’t matter. But for this example we will be using GKE.
You can create a cluster via the UI, or via the gcloud utils like so:
gcloud container \
    --project "[your-project]" clusters create "[cluster-name]" \
    --release-channel None \
    --zone "europe-west3-c" \
    --node-locations "europe-west3-c" \
    --machine-type "e2-standard-2" \
    --image-type "COS_CONTAINERD" \
    --disk-size "50" \
    --enable-autorepair \
    --num-nodes "3"
We can then connect to the cluster using:
gcloud container clusters get-credentials [cluster-name] --zone europe-west3-c --project [your-project]This should also switch your context to the cluster, so whenever you use kubectl, you’ll be within this cluster’s context.
After we’ve done that, we can verify that we can see the nodes with
> kubectl get nodes

NAME                                      STATUS   ROLES    AGE     VERSION
gke-valdas-1-default-pool-cf1cd6be-cvc4   Ready    <none>   4m50s   v1.22.11-gke.400
gke-valdas-1-default-pool-cf1cd6be-q62h   Ready    <none>   4m49s   v1.22.11-gke.400
gke-valdas-1-default-pool-cf1cd6be-xrf0   Ready    <none>   4m50s   v1.22.11-gke.400
GKE comes with the metrics server preinstalled; we can verify that using
> kubectl get pods -n kube-system | grep metrics

gke-metrics-agent-n92rl                              1/1     Running   0          7m34s
gke-metrics-agent-p5d49                              1/1     Running   0          7m33s
gke-metrics-agent-tf96r                              1/1     Running   0          7m34s
metrics-server-v0.4.5-fb4c49dd6-knw6v                2/2     Running   0          7m20s
Note, if your cluster doesn’t have a metrics server, you can easily install it using one command:
kubectl apply -f https://github.com/kubernetes-sigs/metrics-server/releases/latest/download/components.yamlYou can find more info here: https://github.com/kubernetes-sigs/metrics-server
We can also use the `top` command to verify that the metrics are collected:
> kubectl top pods -A

NAMESPACE     NAME                                                 CPU(cores)   MEMORY(bytes)
kube-system   event-exporter-gke-5479fd58c8-5rt4b                  1m           12Mi
kube-system   fluentbit-gke-5r6v5                                  5m           22Mi
kube-system   fluentbit-gke-nwcx9                                  4m           25Mi
kube-system   fluentbit-gke-zz6gl                                  4m           25Mi
kube-system   gke-metrics-agent-n92rl                              2m           26Mi
kube-system   gke-metrics-agent-p5d49                              3m           27Mi
kube-system   gke-metrics-agent-tf96r                              3m           26Mi
kube-system   konnectivity-agent-6fbc8c774c-4vvff                  1m           6Mi
kube-system   konnectivity-agent-6fbc8c774c-lsk26                  1m           7Mi
kube-system   konnectivity-agent-6fbc8c774c-rnvp2                  2m           6Mi
kube-system   konnectivity-agent-autoscaler-555f599d94-f2w5n       1m           4Mi
kube-system   kube-dns-85df8994db-lvf55                            2m           30Mi
kube-system   kube-dns-85df8994db-mvxv5                            2m           30Mi
kube-system   kube-dns-autoscaler-f4d55555-pctcj                   1m           11Mi
kube-system   kube-proxy-gke-valdas-1-default-pool-cf1cd6be-cvc4   1m           22Mi
kube-system   kube-proxy-gke-valdas-1-default-pool-cf1cd6be-q62h   1m           23Mi
kube-system   kube-proxy-gke-valdas-1-default-pool-cf1cd6be-xrf0   1m           26Mi
kube-system   l7-default-backend-69fb9fd9f9-fctch                  1m           1Mi
kube-system   metrics-server-v0.4.5-fb4c49dd6-knw6v                27m          24Mi
kube-system   pdcsi-node-mf6pt                                     2m           9Mi
kube-system   pdcsi-node-sxdrg                                     3m           9Mi
kube-system   pdcsi-node-wcnw7                                     3m           9Mi
Now, let’s create a single replica deployment with resource requests and limits:
apiVersion: apps/v1
kind: Deployment
metadata:
  name: hpa-demo
  labels:
    app: nginx
spec:
  replicas: 1
  selector:
    matchLabels:
      app: nginx
  template:
    metadata:
      labels:
        app: nginx
    spec:
      containers:
      - name: nginx
         image: k8s.gcr.io/nginx-slim:0.8
         ports:
         - containerPort: 80
         resources:
           requests:
             cpu: 200m
           limits:
             cpu: 1000m
Let’s save this to a demo.yaml and run
> kubectl apply -f demo.yamlWe can check that it’s deployed via
> kubectl get deploy -n default

NAME       READY   UP-TO-DATE   AVAILABLE   AGE
hpa-demo   1/1     1            1           17m
Lastly, before configuring HPA, we need to expose a service that we can call to increase the load, which HPA will act upon.
Let’s create a service.yaml like so:
apiVersion: v1
kind: Service
metadata:
  name: hpa-demo
  labels:
    app: nginx
spec:
  ports:
  - port: 80
  selector:
    app: nginx
And apply it using
> kubectl apply -f service.yamlWe can verify that the service is working like so:
> kubectl get services

NAME         TYPE        CLUSTER-IP     EXTERNAL-IP   PORT(S)   AGE
hpa-demo     ClusterIP   10.92.62.191   <none>        80/TCP    7m35s
kubernetes   ClusterIP   10.92.48.1     <none>        443/TCP   48m
As you can see, the hpa-demo service exists.
Finally, we need to configure HPA. To do that, we can create a file called hpa.yaml and fill it in with:
apiVersion: autoscaling/v1
kind: HorizontalPodAutoscaler
metadata:
  name: hpa-demo
spec:
  scaleTargetRef:
    apiVersion: apps/v1
    kind: Deployment
    name: hpa-demo
  minReplicas: 1
  maxReplicas: 5
  targetCPUUtilizationPercentage: 60
Once again, we apply it using
> kubectl apply -f hpa.yamlNow, let’s watch HPA in action using
> kubectl get hpa -w

NAME       REFERENCE             TARGETS   MINPODS   MAXPODS   REPLICAS   AGE
hpa-demo   Deployment/hpa-demo   0%/60%    1         5         1          2m31s
As you can see, nothing is happening. But remember how we created a service earlier? Let’s start generating some load using busybox:
> kubectl run -i --tty load-generator --rm --image=busybox --restart=Never -- /bin/sh -c "while sleep 0.01; do wget -q -O- http://hpa-demo; done"We should immediately see a load increase under our HPA watch command:
hpa-demo Deployment/hpa-demo 16%/60% 1 5 1 8m47sThe load is still not enough to reach our target, but for the sake of this demo, let’s set the targetCPUUtilizationPercentage: 10 and re-apply the hpa.yaml.
Under the watch command, we should see that our target is exceeded and a replica gets added.
hpa-demo   Deployment/hpa-demo   16%/10%         1         5         1          15m
hpa-demo   Deployment/hpa-demo   16%/10%         1         5         2          15m
hpa-demo   Deployment/hpa-demo   9%/10%          1         5         2          16m
We can verify this via
> kubectl get deploy

NAME       READY   UP-TO-DATE   AVAILABLE   AGE
hpa-demo   2/2     2            2           40m
As you can see, we have two pods while the deployment specified only one – so our HPA policy worked.
We can proceed to test downscaling by deleting the load-gen pod:
> kubectl delete pod load-generatorAfter a while, we should see:
NAME       REFERENCE             TARGETS   MINPODS   MAXPODS   REPLICAS   AGE
hpa-demo   Deployment/hpa-demo   0%/10%    1         5         1          26m
This means that downscaling worked.
We can verify that using:
> kubectl get deploy

NAME       READY   UP-TO-DATE   AVAILABLE   AGE
hpa-demo   1/1     1            1           48m
That’s basically it. We’ve seen how we can easily upscale and downscale based on pod resource usage.
Gain real-time cost visibility when using HPA
Increased scalability poses a challenge to cost monitoring and control in Kubernetes because autoscalers constantly adjust capacity.
CAST AI provides a free cost monitoring product you can use to get an hourly, daily, weekly, and monthly overview of your cloud cost.
Connect your cluster in one minute or less to instantly see your current costs in real time and access months of past cost data for comprehensive reporting.
CAST AI clients save an average of 63% on their Kubernetes bills
Connect your cluster and see your costs in 5 min, no credit card required.


Leave a reply
Does autoscaling is also free feature and on what price depends?