If you’re following all the best practices and setting resources and limits for your workloads, Kubernetes will allocate as many resources to each workload as it has specified in the manifest. These resources are basically reserved for that workload. But what happens if your workload fails to use all the resources you allocate to it?
Unused resources represent massive waste in the cloud industry.
But don’t rush to blame Kubernetes here. You’d get the same result if you deployed your application to a too-large VM or bare metal instance.
Kubernetes is here to help you. If you specify the right resource requirements, it will pack your workloads to use as much capacity as it can. The most efficient workload is the one that ends up using most of the requested resources.
Ideally, you want to see workloads utilize all of their assigned resources. This would mean that you’re getting the most out of the money you paid for it.
How do you measure workload efficiency? And what can you do to increase it? Keep reading to find out.
Measuring workload efficiency
If a workload uses just half of the resources assigned, we can say it is 50% efficient. This leads to this simple formula:
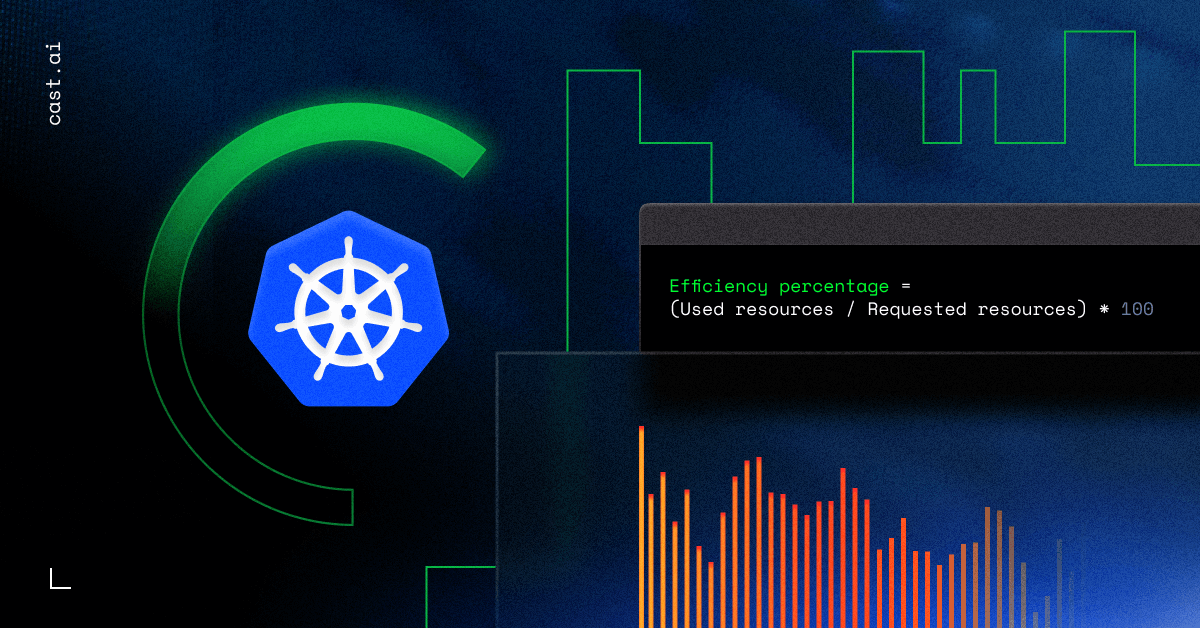
Efficiency percentage = (Used resources / Requested resources) * 100
Note: We can tell how much we pay per workload by multiplying the requested resources by their prices. But how much of that is of actual value, and how much is wasted?
As we just found out, the actual workload cost can include the cost of resources that ended up being wasted. You might be surprised, but these costs can quickly add up! Datadog’s 2020 annual container report found that almost half of the containers used less than a third of their requested CPU and memory.
How do you identify which workloads are efficient and which are wasting money?
Just by looking at the simple formula mentioned above, it’s clear that we need two components: requested resource amount and real usage values.
You can check resource requests in the workload manifest and monitor usage with tools like Prometheus.
Sounds simple? This is actually where things get a bit more complicated.
The simple formula works well, but only for workloads with a constant level of load. In the real world, a workload’s resource usage fluctuates in line with the load it gets. And that load may vary with time.
To guarantee our workload availability and performance in Kubernetes, you need to set workload resources and limits to accommodate the highest expected load. That’s why tracking workload usage over time is essential – this is how you identify the highest usage.
This is often called target resource values, you can learn more about them in this guide to Kubernetes resource limits.
How to calculate the overall workload efficiency
We often have no control over a workload’s resource usage fluctuation – for example, the different loads of an e-commerce store throughout the day. In the real world, we need to use resource target values instead of average or instant resource usage.
If a workload requests more resources than identified in the target values, it’s clear that this workload isn’t that efficient.
Imagine a workload that needs 16 CPUs during peak load, but requests 20 CPU cores. That 4 CPU of difference represents wasted resources, and we could say that the workload’s CPU usage efficiency is around 80%.
The same applies to RAM. By combining the CPU and RAM efficiency, you can calculate the overall efficiency of your workload.
Still, note that CPU is a more expensive resource (CPU cores versus GB of RAM). So, when calculating the combined efficiency, give more weight to CPU efficiency. Not sure what ratio to use? Check out this guide for a detailed calculation: How To Calculate CPU vs. RAM Costs For More Accurate K8s Cost Monitoring
Note: To calculate waste over time, use resource hours
To make your calculations more accurate, use resource hours – resources multiplied by hours of utilization.
For example, if a workload with requests set at 2 CPUs runs for 48 hours over the given time, the total requested CPU hours would be 96.
If that workload’s average CPU utilization is 0.5 CPU throughout those 48 hours, its total usage is 24 CPU hours.
To compute the number of wasted CPU resources, just subtract that workload’s utilized resources from the total number of requested resources: 96 CPU hours = 24 CPU hours minus 72 CPU hours.
Now it’s simple to calculate waste in dollar terms – you just need to multiply wasted resource hours by the resource hourly price: for example, 72 CPU hours * $0.038 = $2.7.
Adjust workload resources to improve efficiency
Now that you know how to measure and calculate workload efficiency, it’s time to monitor and find resource target values.
One way to identify target values is by manually monitoring resource usage in your workloads and finding peak usage. You can make your life easier here by setting up tools like the Vertical Pod Autoscaler.
After finding your target values, you’re ready to adjust workload resources with the goal of improving performance and reducing waste.
In Kubernetes, rightsizing requires significant effort. So instead of tinkering with a relatively cheap workload, aim for maximum impact and start with large and low-hanging fruit: costly workloads with considerable overprovisioned resources.
To get started, check out the 8 steps to resource rightsizing in Kubernetes I outlined in this guide: How to manage Kubernetes resource limits and requests for cost efficiency
Scaling for peak periods
If your application load is fluctuating gradually and you generally implemented your app with scalability in mind, it’s smart to enable vertical or horizontal pod autoscaling to reduce the gap between actual usage and target values.
For example, if the load is low during the night, you can automatically reduce resources for this time of day or slash the number of replicas. Kubernetes Vertical Pod Autoscaler or Horizontal Pod Autoscaler can do this for you.
When workload resources are reduced, the Cluster Autoscaler can lower the number of virtual machines or their sizes. This generates tangible cost savings. This is the power of Kubernetes automatization!
For more best practices around autoscaling, check out this guide: Guide to Kubernetes Autoscaling For Cloud Cost Optimization
Dealing with spiky workloads
Workloads that have very short and high resource usage spikes occasionally but low usage most of the time are your least efficient workloads.
Resource requests need to be set high enough to accommodate those spikes, so resources are reserved but end up not being used most of the time.
If CPU usage is spiking and workload performance is not critical, you can sometimes set resources to lower values than the highest spikes. That depends on the nature of your workload – while some workloads can handle CPU throttling, others will crash or become unresponsive.
When the spikes are happening in RAM, you can’t set it to lower than the expected usage during the peak. Otherwise, you risk an Out Of Memory kill for the pod.

If your application needs a very high amount of resources for its spikes, it might be worth optimizing it in the code: finding memory leaks, using thread and connection pools, limiting caching, reducing memory allocations, and adding throttling.
Check your workload’s efficiency instantly
CAST AI’s free cost monitoring module gives you a wealth of data about your Kubernetes workloads.
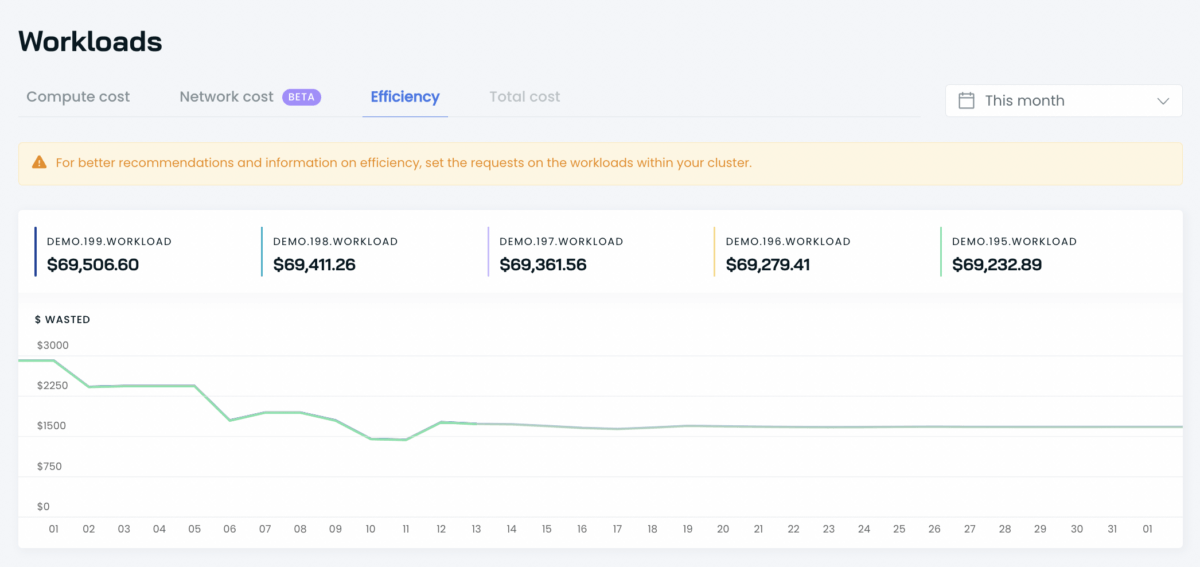
You will be able to see all your cluster workloads with their efficiency details within the selected period:
- total requested resources (CPU and RAM),
- total used resources (CPU and RAM),
- and resources wasted.
Connect your cluster and check how many CPUs and GiBs your workload is actually using to set the right limits and requests, and boost its efficiency.
Connect your cluster and see your costs in real time
No credit card required.



Leave a reply