


Most database optimization techniques get recommended in the wrong order. Teams reach for config flags first because flags are cheap to change.
Meanwhile a 3 ms query runs forty million times a day and nobody looks at it.
Database optimization reduces unnecessary database work while protecting correctness and application performance. These eleven techniques cover query analysis, indexing, batching, pooling, caching, configuration, rewrites, replicas, schema design, measurement, and automation. Their order is a diagnostic workflow, not a universal impact ranking. Prioritize the measured bottleneck and your application SLOs.
Key Takeaways: Database Optimization Techniques Ranked
Start with evidence and a baseline, then choose the technique that addresses the observed constraint. The likely payoff varies by workload; measurement belongs before and after every change.
- Find the queries that actually hurt. Highest impact, lowest effort, and it reprioritizes everything after it.
- Index what the workload proves it needs. The plan decides, not intuition.
- Eliminate N+1 query patterns. Call count, not latency, is the tell.
- Pool your connections. The database needs a stable connection count.
- Cache the reads that repeat. Invalidation is the real cost.
- Right-size the configuration. Real but bounded, and where many teams waste a quarter.
- Rewrite the queries worth rewriting. Medium to high, query by query.
- Add read replicas where caching cannot help. Diverse read workloads only.
- Fix the schema decisions that tax every query. A long tail you pay on every operation.
- Measure before and after. Enabling work, without which nothing is provable.
- Automate the loop so the work stays done. Every gain above decays without a cadence.
| Technique | Typical impact | Effort | Further reading |
|---|---|---|---|
| 1. Find the queries that actually hurt | Highest. Reprioritizes everything after it. | Low | SQL query optimization |
| 2. Index what the workload proves it needs | High. Turns row scans into index lookups. | Low to medium | SQL query optimization |
| 3. Eliminate N+1 query patterns | High on ORM-heavy apps. Removes thousands of round trips. | Medium | N+1 query patterns |
| 4. Pool your connections | High under autoscaling. Removes queueing and context switching. | Medium | Connection pooling |
| 5. Cache the reads that repeat | High for small hot read sets. | Medium plus invalidation | Read replicas vs caching |
| 6. Right-size the configuration | Bounded. Real on IO-bound or memory-starved instances. | Low to medium | Tuning vs optimization |
| 7. Rewrite the queries worth rewriting | Medium to high, query dependent. | Medium to high | SQL query optimization |
| 8. Add read replicas where caching cannot help | Medium, read-heavy diverse workloads only. | Medium to high | Read replicas vs caching |
| 9. Fix the schema decisions that tax every query | Long-tail, paid on every query. | High, hard to retrofit | Database schema design |
| 10. Measure before and after | Enabling. Makes the rest provable. | Low | Database monitoring and metrics |
| 11. Automate the loop so the work stays done | Compounding. Gains decay without it. | Medium | Database optimization tools |
Effort means calendar effort, not difficulty in theory. Technique 10 changes no query, so it ranks low alone, but it makes every other row provable. Technique 9 ranks last on effort because schema changes cost most to retrofit.
1. Find the queries that actually hurt
Use total execution time to prioritize aggregate capacity work. Also inspect individual latency regressions and application SLOs: a rarely executed query can still be critical to a user-facing request.
What it is
Query statistics normalized by fingerprint and accumulated by the server: pg_stat_statements on PostgreSQL, performance_schema on MySQL.
When it applies
Always first. Every production instance, every incident, every capacity review. Reread it after each change.
The command to start with
-- PostgreSQL 14+; top-level statistics in the current database
SELECT queryid, calls,
       round(total_exec_time::numeric/1000,1) AS total_s,
       round(mean_exec_time::numeric,2) AS mean_ms,
       round((100*total_exec_time/NULLIF(sum(total_exec_time) OVER (),0))::numeric,1) AS pct_total,
       round((100*sum(total_exec_time) OVER (ORDER BY total_exec_time DESC)
              /NULLIF(sum(total_exec_time) OVER (),0))::numeric,1) AS cum_pct,
       left(regexp_replace(query,'\s+',' ','g'),70) AS query
FROM pg_stat_statements
WHERE toplevel AND dbid = (SELECT oid FROM pg_database WHERE datname = current_database())
ORDER BY total_exec_time DESC LIMIT 15;

-- MySQL 8.0/8.4: verify performance_schema and statement consumers are enabled
SELECT SCHEMA_NAME, DIGEST_TEXT, COUNT_STAR,
       ROUND(SUM_TIMER_WAIT/1e12,1) AS total_s,
       ROUND(AVG_TIMER_WAIT/1e9,2) AS mean_ms,
       ROUND(SUM_ROWS_EXAMINED/NULLIF(COUNT_STAR,0),1) AS rows_examined_per_call
FROM performance_schema.events_statements_summary_by_digest
ORDER BY SUM_TIMER_WAIT DESC LIMIT 15;
On PostgreSQL the extension needs shared_preload_libraries set, a restart, and CREATE EXTENSION. Read the cumulative percentage column: twelve queries usually account for the total. On MySQL, prefer performance_schema to the slow log, which only records statements past a threshold.
The trap
Mean latency and total time answer different questions. Review both, then correlate high-call-count patterns with application traces. Verify the observation window, reset history, and evictions using pg_stat_statements_info. With normal statistics persistence enabled, a clean PostgreSQL restart need not reset these counters.
2. Index what the workload proves it needs
Build indexes on plan evidence, and drop them on scan evidence.
What it is
An index turns a selective scan into a lookup, so O(rows) becomes O(log rows) plus a heap fetch.
When it applies
Apply it when a top-time query scans far more rows than it returns. The predicate must be selective, and sort must not be the bottleneck.
The command to start with
-- PostgreSQL: check for a long transaction that would stall the build
SELECT pid, now() - xact_start AS xact_age, state, left(query, 60) AS query
FROM pg_stat_activity
WHERE xact_start < now() - interval '1 minute'
ORDER BY xact_start;

-- read the plan first, then the Rows Removed by Filter line
EXPLAIN (ANALYZE, BUFFERS)
SELECT id, customer_id, created_at FROM orders
WHERE customer_id = 48213 ORDER BY created_at DESC LIMIT 20;

-- then, if the plan shows a seq scan with high rows removed by filter
CREATE INDEX CONCURRENTLY idx_orders_customer_created
  ON orders (customer_id, created_at DESC);

-- MySQL 8.0.18+: EXPLAIN ANALYZE executes the query
EXPLAIN ANALYZE SELECT id, customer_id, created_at FROM orders
WHERE customer_id = 48213 ORDER BY created_at DESC LIMIT 20;
A healthy index path looks like this: Limit (cost=0.43..812.55 rows=20 width=40) (actual time=0.061..7.412 rows=20 loops=1) — Index Scan using idx_orders_customer_created on orders (actual time=0.058..7.398 rows=20 loops=1) Index Cond: (customer_id = 48213) Buffers: shared hit=214 The condition is answered on the index, and only twenty rows reach the heap. Swap in the unindexed version and the same query reports a Seq Scan with thousands of Rows Removed by Filter, which is the number that sizes the index you need.
The trap
Inspect the plan before adding an index, including predicate selectivity, expression matching, ordering, and buffers. CREATE INDEX CONCURRENTLY permits normal writes but takes locks that can conflict with DDL and maintenance, waits during build phases, and can leave an invalid index after failure. Monitor the build and inspect pg_index.indisvalid before a reviewed retry.
The opposite discipline: indexes that cost more than they earn
Indexes add storage and maintenance work, but a low scan count alone does not prove an index is unnecessary. Unique constraints, rare critical queries, replica reads, and PostgreSQL HOT updates affect the decision. Review the full workload and dependency evidence before dropping anything.
-- PostgreSQL 16/17/18: indexes that have not earned their write cost
SELECT schemaname, relname AS table_name, indexrelname AS index_name, idx_scan,
       pg_size_pretty(pg_relation_size(indexrelid)) AS size
FROM pg_stat_user_indexes
WHERE idx_scan < 50
  AND NOT EXISTS (SELECT 1 FROM pg_constraint c
                  WHERE c.conindid = pg_stat_user_indexes.indexrelid)
  AND NOT EXISTS (SELECT 1 FROM pg_index i
                  WHERE i.indexrelid = pg_stat_user_indexes.indexrelid
                    AND (i.indisunique OR i.indisprimary))
ORDER BY pg_relation_size(indexrelid) DESC;

-- MySQL 8.0/8.4: the sys view first
SELECT * FROM sys.schema_unused_indexes;
-- tables with no PRIMARY KEY are excluded from that view; check them directly
SELECT OBJECT_NAME, INDEX_NAME, COUNT_STAR
FROM performance_schema.table_io_waits_summary_by_index_usage
WHERE INDEX_NAME IS NOT NULL AND INDEX_NAME <> 'PRIMARY' AND COUNT_STAR = 0
ORDER BY OBJECT_NAME, INDEX_NAME;
The trap when dropping
Inspect the statistics reset time and collection history; resets and unclean shutdowns can shorten the window, while a clean restart normally preserves statistics. Include monthly and quarterly jobs, replica usage, and integrity requirements before interpreting a low scan count as a removal candidate.
3. Eliminate N+1 query patterns
Each individual read in this pattern is fast, and the aggregate is not.
What it is
An ORM or batch loop issues one query per parent row instead of one per set: one hundred orders become 101 statements. Slow logs miss it at typical thresholds, because each statement runs well under them.
When it applies
Any app with a lazy-loading ORM: Hibernate, ActiveRecord, Prisma, Django without select_related. Also common in GraphQL resolvers and services that fan out per item. The fix lives in application code, often at the ORM layer: JPA JOIN FETCH, ActiveRecord includes, Django select_related for foreign keys and prefetch_related for collections, Prisma include.
The command to start with
-- PostgreSQL: high call count, trivial mean time
SELECT query, calls, round(mean_exec_time::numeric,2) AS mean_ms,
       round(total_exec_time::numeric,1) AS total_ms,
       round((rows::numeric/NULLIF(calls,0)),1) AS avg_rows_per_call
FROM pg_stat_statements
WHERE calls > 1000 AND mean_exec_time < 5
ORDER BY calls DESC LIMIT 20;

-- MySQL 8.0/8.4
SELECT digest_text, count_star,
       ROUND(AVG_TIMER_WAIT/1e9,2) AS avg_ms,
       ROUND(SUM_ROWS_SENT/NULLIF(COUNT_STAR,0),1) AS rows_per_call
FROM performance_schema.events_statements_summary_by_digest
WHERE count_star > 1000 AND AVG_TIMER_WAIT/1e9 < 5
ORDER BY count_star DESC LIMIT 20;
Watch for a shape like SELECT … FROM items WHERE order_id = $1 with millions of calls. The PostgreSQL slow-query guide includes N+1 diagnosis. Replace the per-row lookup with one IN-list or join per page: a hundred-order page drops from 101 statements to 2. Datasets that cannot be joined in one pass get a batched count instead. One GROUP BY over the ids in hand keeps the call count flat as the page grows.
The trap
The trap is treating N+1 as a query-tuning problem. You cannot index your way out of forty thousand round trips per minute; you batch them. A second trap bites after the fix: without a snapshot the one large query disappears into your totals, so you cannot prove the win.
4. Pool your connections
PostgreSQL uses a backend process per connection. Useful concurrency depends on CPU, I/O, locking, and query shape; adding connections beyond saturation can worsen latency and memory pressure.
What it is
A pooler multiplexes application connections onto far fewer real database connections, so the database sees a capped, stable count while pods autoscale.
When it applies
When the idle-to-total ratio is high, counts spike with autoscaling, and transactions are short. Long analytical sessions gain little from it.
The command to start with
-- PostgreSQL: measure before you size anything
SELECT count(*) AS total,
       count(*) FILTER (WHERE state='idle') AS idle,
       count(*) FILTER (WHERE state='active') AS active,
       count(*) FILTER (WHERE wait_event_type='Lock') AS waiting_on_lock
FROM pg_stat_activity WHERE backend_type='client backend';
SHOW max_connections;

-- MySQL 8.0/8.4
SELECT COUNT(*) AS threads_connected FROM information_schema.processlist;
SHOW VARIABLES LIKE 'max_connections';
Treat core-based pool formulas as test starting points, not hard limits. Twenty pods with eight connections each can demand 160 backend slots without a shared pooler. Budget all pooler replicas, per-user/database pools, direct clients, and administrative headroom, then load-test throughput and wait time.
The trap
A high idle count suggests reviewing client pool lifetimes and aggregate connection budgets. PgBouncer’s default_pool_size applies per user/database pair. Transaction pooling does not guarantee session continuity, so validate session parameters, temporary objects, locks, and driver behavior against the installed version.
Use session pooling or a direct connection for features that require a persistent backend, such as LISTEN. Modern PgBouncer supports protocol-level prepared statements when configured appropriately; prepared statements are not a blanket reason to reject transaction pooling. See the connection pooler comparison.
5. Cache the reads that repeat
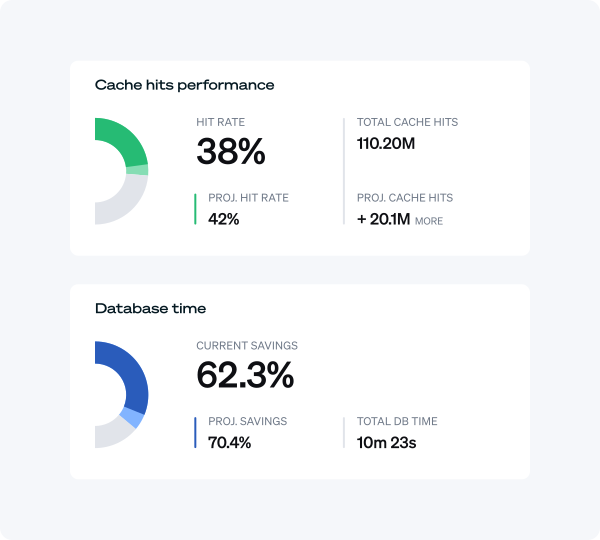
Caching removes work instead of reallocating it.
What it is
Serving repeated identical reads from memory. A cached response is close to one network round trip.
When it applies
Read-heavy workloads with a small, stable hot set: catalog pages, dashboards, reference data, anything tolerant of seconds of staleness. Write-path queries and volatile functions fit badly.
The command to start with
-- PostgreSQL: prove a query repeats and reads well already
SELECT query, calls,
       round(mean_exec_time::numeric,2) AS mean_ms,
       left(regexp_replace(query,'\s+',' ','g'),70) AS query_shape
FROM pg_stat_statements
WHERE query ILIKE 'SELECT%' AND calls > 1000
ORDER BY calls DESC LIMIT 15;
High call counts identify repeated query shapes, not necessarily repeated results. Normalization removes literal values, so inspect parameter repetition, result size, volatility, and consistency requirements before deciding a query is cacheable.
The trap
Caching can reduce repeated work but does not remove slow cache misses or correctness obligations. In cache-aside, the application loads missing data and manages invalidation. Write-through updates the cache as part of the write path; it is a distinct pattern. Choose a freshness and invalidation design explicitly, then measure net benefit rather than assuming one hit-rate threshold works everywhere.
6. Right-size the configuration
Configuration tuning is real work, and it does not outrank a missing index.
What it is
Database performance tuning means server parameters over memory, WAL and IO behaviour, and planner cost constants. On PostgreSQL: shared_buffers, effective_cache_size, work_mem, random_page_cost. On MySQL the dominant knob is innodb_buffer_pool_size, often 60 to 75 percent of RAM.
When it applies
Tune a parameter when evidence connects it to the bottleneck, such as sort spills or buffer pressure. High CPU with a healthy cache-hit rate can still indicate inefficient SQL or excess concurrency; it does not automatically justify a larger instance.
The command to start with
-- PostgreSQL 16/17/18
SELECT name, setting, unit, source, context, pending_restart
FROM pg_settings
WHERE name IN ('shared_buffers','effective_cache_size','work_mem',
  'maintenance_work_mem','wal_buffers','random_page_cost')
ORDER BY name;

-- MySQL 8.0/8.4
SHOW VARIABLES WHERE Variable_name IN ('innodb_buffer_pool_size',
  'innodb_log_file_size','innodb_io_capacity','table_open_cache');
pg_settings.source describes where a value came from, not whether it can be changed. Inspect context, pending_restart, privileges, and managed-service controls. PostgreSQL work_mem can apply to multiple sort or hash operations and parallel workers; hash settings can multiply memory use. Evaluate aggregate demand before raising it.
The trap
Configuration changes should follow a specific hypothesis. Increasing memory cannot compensate for every inefficient query, and changing several settings at once makes attribution difficult. Change a bounded set, measure the outcome, and retain a rollback plan.
7. Rewrite the queries worth rewriting
Rewrite only what the plan calls structurally wrong, and leave the rest alone.
What it is
Changing the SQL so the planner builds a better plan. A correlated subquery becomes a join, a redundant ORDER BY goes, and an unbounded scan gets a LIMIT.
When it applies
When the query stays near the top of the cumulative list after indexes exist, read the plan for structural cost. Repeated SubPlan nodes, a sort spilling to disk, or a nested loop over a large inner relation all qualify.
The command to start with
-- PostgreSQL: inspect the plan shape
EXPLAIN (ANALYZE, BUFFERS, VERBOSE)
SELECT c.id, c.name,
       (SELECT count(*) FROM orders o WHERE o.customer_id = c.id) AS order_count
FROM customers c
WHERE c.created_at > now() - interval '30 days';

-- MySQL 8.0.18+: the join equivalent
EXPLAIN ANALYZE SELECT c.id, c.name, COUNT(o.id) AS order_count
FROM customers c LEFT JOIN orders o ON o.customer_id = c.id
WHERE c.created_at > now() - interval '30 days'
GROUP BY c.id, c.name;
A correlated subquery and a join can produce different execution strategies. Neither is universally faster. Preserve NULL, duplicate, grouping, and ordering semantics, then compare plans, buffers, runtime, and representative parameters on the same engine.
The trap
Rewriting by taste is its own trap: a 40 line query that is slow for want of an index becomes a 40 line query that is slow and unfamiliar. An ORM update can also silently revert the rewrite, and the planner may pick a different plan on different data.
8. Add read replicas where caching cannot help
Replicas buy read capacity without adding any write capacity.
What it is
A read replica is a full second copy serving SELECTs, offloading the primary through streaming replication on PostgreSQL or binlog replication on MySQL.
When it applies
Read-skewed workloads with diverse reads rather than a small hot set, analytics tolerant of stale data, and geographic read locality. Poor when writes are the bottleneck, worse when 95 percent of reads already hit a cache.
The command to start with
-- PostgreSQL: check lag on the primary
SELECT application_name, client_addr, state,
       write_lag, flush_lag, replay_lag
FROM pg_stat_replication;

-- MySQL 8.0/8.4
SHOW REPLICA STATUS\G
Lag decides whether a replica is safe for a read path: milliseconds under steady load, seconds or minutes during a bulk load. On managed replicas you often cannot read pg_stat_replication, so watch the provider lag metric instead.
The trap
A replica cannot fix a write bottleneck, since the saturated primary gains nothing and the replica adds traffic. The next failure is read-your-writes, where a user who inserts and reloads reads a lagging copy. Keep post-write reads on the primary, and budget for failover runbooks, lag alerting, and slots that pin WAL until a stalled replica catches up.
9. Fix the schema decisions that tax every query
A schema choice is paid on every operation for as long as the table exists.
What it is
Column types set row width and index size. Key type sets index density and insert locality. Normalization sets how many joins sit on the hot path.
When it applies
Review key and column types early, because later migrations can be expensive. UUID and integer keys differ in width, locality, and distribution properties; the performance effect depends on schema, engine, workload, and implementation. Benchmark your actual insert and read paths before migrating.
The command to start with
-- PostgreSQL 16/17/18: chart the size cost per table
-- Main relation excludes TOAST; total includes indexes and auxiliary storage
SELECT t.relname,
       pg_size_pretty(pg_relation_size(t.relid)) AS main,
       pg_size_pretty(pg_indexes_size(t.relid)) AS indexes,
       pg_size_pretty(pg_total_relation_size(t.relid)) AS total, t.n_live_tup
FROM pg_stat_user_tables t JOIN pg_class c ON c.oid = t.relid
ORDER BY pg_total_relation_size(t.relid) DESC LIMIT 20;

-- MySQL 8.0/8.4
SELECT table_name, table_rows,
       ROUND(data_length/1024/1024,1) AS data_mb,
       ROUND(index_length/1024/1024,1) AS index_mb
FROM information_schema.tables
WHERE table_schema = DATABASE()
ORDER BY data_length+index_length DESC LIMIT 20;
InnoDB organizes data by its primary key and carries primary-key values in secondary indexes, so key width and insertion locality matter. DDL behavior is operation- and version-specific. PostgreSQL alterations may rewrite a table or be metadata-only; MySQL supports instant and in-place operations for selected changes. A rebuild is not automatically fully offline, but metadata locks and operational risks remain.
The trap
Avoid changing key types for a generic benchmark claim. Measure storage, insert throughput, replication effects, and migration cost for the actual schema. Denormalize only when the read benefit justifies consistency and maintenance complexity.
10. Measure before and after
Without a baseline every optimization is an opinion. With one, every change is provable.
What it is
Snapshot statistics and plans before and after a change, so the delta is attributable to that change.
When it applies
Before the first change, after each change, and on a cadence between deploys. The snapshot costs one query, and it is the difference between a fix and a coincidence.
The command to start with
-- PostgreSQL 16/17/18
-- Use a fresh session; temporary data disappears when it closes.
CREATE TEMP TABLE stats_snap AS
SELECT now() AS captured_at, userid, dbid, queryid, toplevel, calls, rows,
       total_exec_time, mean_exec_time, shared_blks_hit, shared_blks_read
FROM pg_stat_statements;

EXPLAIN (ANALYZE, BUFFERS)
SELECT id FROM orders WHERE customer_id = 48213
ORDER BY created_at DESC LIMIT 20;

-- MySQL 8.0/8.4
CREATE TEMPORARY TABLE stats_snap AS
SELECT NOW() AS captured_at, DIGEST, SCHEMA_NAME, COUNT_STAR, SUM_TIMER_WAIT,
       SUM_ROWS_EXAMINED, SUM_ROWS_SENT
FROM performance_schema.events_statements_summary_by_digest;
Measure comparable baseline and post-change intervals. PostgreSQL snapshots must match on userid, dbid, queryid, and toplevel; account for resets and evictions. A rewrite can change the identifier. See the PostgreSQL guide’s interval comparison for a complete example.
The trap
One timing run does not establish causality. EXPLAIN ANALYZE executes the statement; test side-effecting SQL in staging first. Rollback does not undo every effect, such as sequences or external calls. Compare equivalent workload windows and cache conditions, and account for unrelated changes.
11. Automate the loop so the work stays done
The first ten techniques decay whenever a release shifts the workload. A loop keeps them from drifting back.
What it is
A cadence that re-runs the ranking, checks unused indexes and statistics freshness, then re-baselines. On MySQL, validate statistics by comparing estimates to observed row counts on the largest tables, then run ANALYZE TABLE selectively rather than on a standing schedule.
When it applies
Weekly for the ranked list, monthly for indexes and schema, and on every deploy that changes query shape.
The command to start with
-- PostgreSQL 16/17/18: drift check for dead tuples and stale stats
SELECT relname, n_live_tup, n_dead_tup,
       last_autovacuum, last_autoanalyze,
       pg_size_pretty(pg_total_relation_size(relid)) AS size
FROM pg_stat_user_tables
WHERE n_dead_tup > 10000 OR last_autoanalyze < now() - interval '7 days'
ORDER BY n_dead_tup DESC LIMIT 20;

-- MySQL 8.0/8.4: inspect estimates; this does not count table rows
SELECT t.TABLE_SCHEMA, t.TABLE_NAME, t.TABLE_ROWS AS estimated_rows,
       t.UPDATE_TIME
FROM information_schema.TABLES t
WHERE t.TABLE_SCHEMA = DATABASE()
ORDER BY t.DATA_LENGTH DESC LIMIT 20;
-- If needed, run SELECT COUNT(*) FROM your_table separately.
-- Exact counts can be expensive; choose a safe environment and window.
Make the cadence an owned artifact, such as a cron job that posts the top 20 to a shared channel. Artifacts outlive the person who set them up.
The trap
Teams assume the loop runs because it ran once. A cadence kept in one engineer’s memory works until that engineer goes on leave. The second trap is automating the wrong end: deciding what to change needs judgment, while collecting evidence does not.
Where automation fits: Cast AI Database Optimization
Cast AI Database Optimization covers three parts of this list, each as one bounded flow.
Evidence ranking supports techniques 1 and 2. Cast AI’s read-only Performance Advisor prioritizes index and query-rewrite recommendations for supported PostgreSQL and MySQL workloads. Review index dependencies and representative usage before applying or removing an index; the advisor does not apply schema changes.
The optional proxy supports pooling and eligible query caching, corresponding to techniques 4 and 5. Current deployment guidance covers Kubernetes and MySQL on ECS. Pooling does not eliminate application N+1 behavior. Validate session compatibility, authentication, cache consistency, and operating cost before enabling proxy traffic.
Impact projection for technique 10. Query recommendations compare the original and improved plans side by side on planning time, plan rows, and execution time, so you see the expected delta before you apply anything. What it does not do: manage server parameters, apply DDL, or route reads to replicas.
Conclusion
Start with technique 1. Ranking by cumulative database time costs twenty minutes and reorders what you knew. Let the list decide what comes next, because the top row differs for almost every team: an unindexed join here, a 40 million call lookup there.
For the signal collection behind this workflow, read the database observability guide. For the observation and ranking half handled continuously, Cast AI Database Optimization is built for exactly that.
FAQ
What are the best database optimization techniques for PostgreSQL?
For capacity work, rank pg_stat_statements by total execution time while also checking application latency SLOs. Use plans to evaluate indexes and rewrites, batch N+1 access patterns, and assess pooling or caching where appropriate. Review constraints and representative usage before removing indexes, and compare baseline and post-change windows.
What are the best database optimization techniques for MySQL?
Use MySQL Performance Schema or the sys schema to identify expensive statements, then inspect plans and application access patterns. EXPLAIN ANALYZE is available from MySQL 8.0.18 and executes the query. Evaluate indexes, pooling, caching, and configuration according to the measured bottleneck and the engine version.
What is the difference between database tuning and database optimization?
In short, tuning is a subset of optimization, and usually the smaller one. Tuning adjusts server parameters such as shared_buffers, work_mem, and innodb_buffer_pool_size. Optimization changes what the database is asked to do: queries, indexes, schema, access patterns, connection topology. A missing index or an N+1 fix removes work outright, where a parameter change only reallocates it. Practical rule: tune when a specific resource is provably at its ceiling.
How often should you revisit database optimization?
Set a cadence. Weekly for the top 20 to 50 queries by cumulative database time. Monthly for unused indexes, statistics freshness, and table bloat. Every deploy that changes query shape or adds an ORM association. Re-baseline after each material change so you can separate a fix from a coincidence. Schedule it rather than remembering it, because the remembered version stops the moment one engineer gets busy.
Which database optimization techniques can be automated?
Evidence collection, ranking, and recommendation generation can be automated. Pooling and caching can operate continuously after configuration and compatibility review. Schema and query changes require appropriate validation and change controls; automation scope depends on the tool and permissions.


