


The best database optimization tool depends on the bottleneck: slow SQL, missing indexes, excess connections, repeated reads, or configuration. Native PostgreSQL and MySQL tools are useful starting points when enabled and supported. Commercial products can add historical analysis, recommendations, and operational workflows; proxies can change how traffic reaches the database.
Most tools here observe or recommend; few act. That split decides outcomes: a recommendation queue nobody works through does nothing for latency. Nine entries follow, plus the case where no tool is the answer.
Key takeaways
- Start with the bottleneck: SQL, indexes, connections, repeated reads, or configuration.
- Distinguish tools that observe, recommend, execute schema changes, or optimize the runtime path.
- Compare engine support, history, permissions, operational effort, and current pricing models.
- Validate recommendations and measure outcomes against representative application traffic.
How to choose: the jobs and the one criterion that matters
- Find the slow queries. Identify which database queries consume the most time and resources.
- Fix the indexes. Find indexes that could make frequently used queries faster, and identify indexes that are no longer useful.
- Manage the connections. Prevent too many application connections from overwhelming the database.
- Cache frequent reads. Store frequently requested results so the database doesn’t have to process the same requests repeatedly.
- Tune configuration. Adjust database settings to match the workload and available resources.
Then sort each tool by what it does with what it finds:
- Observe: records what happened and stops there.
- Recommend: diagnoses the problem and hands you a fix that a person applies.
- Act: changes the path traffic takes to the database, with no person in between.
Separate advisory tools from tools that execute changes. Cast AI’s Performance Advisor is read-only, while an explicitly invoked utility such as Percona’s pt-online-schema-change can modify schema. Proxy pooling and caching also change runtime behavior and require compatibility testing; a connection-string rollback needs operational planning, not just a text edit.
The native tools show why the split matters. PostgreSQL 18 documents pg_stat_statements as tracking execution statistics for every statement the server runs, plus planning statistics when track_planning is on. The cost is a shared_preload_libraries change, a restart, and CREATE EXTENSION. Every slow query then has a number. Counters leave three gaps: no history beyond cumulative totals (a reset wipes your baseline), no single view of unused indexes across a primary and its replicas (usage counters are kept per server), and no projected plan showing what a new index would change.
The act layer is smaller. Poolers multiplex connections and caches store repeated reads; neither needs a migration.
The comparison table
Database optimization tools compared, November 2026. Covering slow query analysis, index advice, connection pooling, and read caching across PostgreSQL, MySQL, and managed engines, with the limitation named for each. Short version of the pairing people search most: pganalyze goes deeper on PostgreSQL plan history and index advice but charges per server and does not touch other engines, while Percona PMM costs nothing and covers MySQL, MongoDB, and Valkey at the price of running the monitoring server yourself.
| Tool | Best use | Main trade-off |
|---|---|---|
| Native PostgreSQL tools | Investigate query time and execution plans. | Enable the required extensions; collect your own history. |
| Native MySQL tools | Inspect statements, waits, and slow-query logs. | Configure instrumentation and interpret results yourself. |
| pganalyze | PostgreSQL query history and index advice. | PostgreSQL-focused; your team reviews and applies changes. |
| Percona PMM + Toolkit | Self-hosted monitoring and database utilities. | Operate PMM yourself; some Toolkit commands execute changes. |
| Datadog DBM | Connect database performance with application monitoring. | A separately priced product; recommendations still need action. |
| AWS CloudWatch Database Insights | Investigate supported RDS and Aurora workloads. | Capabilities vary by engine, configuration, and service mode. |
| SolarWinds DPA | Wait-time analysis and tuning advice across database estates. | Commercial deployment; your team implements the fixes. |
| PgBouncer / PgCat / ProxySQL | Control database connections through a proxy. | Engine support and session compatibility differ by pooler. |
| Cast AI Database Optimization | Read-only index and query advice; optional pooling and caching. | Review advisory changes; validate proxy compatibility separately. |
The tools, one honest block each
1. Native PostgreSQL tooling: pg_stat_statements, EXPLAIN, pg_stat_activity
PostgreSQL provides native inspection facilities, while pg_stat_statements requires the extension and preload configuration. Its counters include calls, execution time, rows, and resource activity. For a practical workflow, see finding and fixing slow PostgreSQL queries.
The costs: shared memory at startup means a restart, and the table is cumulative, so a reset wipes your baseline.
EXPLAIN ANALYZE shows the real plan with timings for a query you already suspect. auto_explain logs plans for slow statements automatically (PostgreSQL 18 docs), so regressions land in logs rather than a dashboard.
The fit: one instance, a few hundred GB, predictable workload, an hour a week.
2. Native MySQL tooling: performance_schema, sys schema, slow query log
MySQL has the equivalent, with the same trade-off. performance_schema instruments statements, waits, stages, and mutexes, configurable per consumer (MySQL reference manual). The sys schema wraps raw tables in readable views, and statement_analysis plus schema_unused_indexes cover two of the five jobs alone.
For slow queries, lower long_query_time until the entries that matter appear, then run pt-query-digest on the log. None of these writes a CREATE INDEX.
3. pganalyze: PostgreSQL-focused analysis and advice
pganalyze is the native tools with someone else owning the analysis: per-query history, plans collected through auto_explain, and I/O time separated from CPU time over time (pganalyze.com). Its index advisor tests hundreds of index combinations and flags unused indexes cluster-wide.
The limit sits in the docs: every recommendation arrives as a CREATE INDEX you copy and run (pganalyze Index Advisor page), which puts it in the recommend class.
Its Index Advisor models write cost and table constraints when it scores candidates, so the recommendation already carries an estimate of the write tax. The remaining judgement is yours, and three checks decide it. Write load on the target table comes first: a heavy UPDATE rate makes every index a write tax. Build time comes from a CREATE INDEX CONCURRENTLY run in staging against comparable data. Writer blocking comes last, and it decides the method. Use CONCURRENTLY on any table taking production traffic, accept that it fails partway leaving an invalid index, and run it where you can watch it.
pganalyze uses subscription plans with server-based accounting. Verify primary and replica treatment, retention, and deployment options on its current pricing page rather than assuming a fixed fleet cost.
4. Percona PMM and Percona Toolkit: the open source path across engines
Percona PMM is open source and self-hosted, covering MySQL, PostgreSQL, MongoDB, and Valkey with no paid edition (Percona PMM GitHub README). Query Analytics ranks queries by load and Advisors flag misconfiguration.
Percona Toolkit includes tools with different effects. pt-query-digest analyzes query logs, while pt-online-schema-change executes schema changes using a copy-and-swap workflow. It reduces prolonged blocking for supported operations but still needs metadata locks and careful handling of load, replicas, and constraints. Review its operational limitations before use.
5. Datadog Database Monitoring: for teams already on Datadog
Datadog DBM tracks latency and rows returned per query (Datadog Database Monitoring page), correlating them with traces and plans, and nothing on the page claims a rewritten query, a created index, a cached result, or a pooled connection. For a Datadog team the marginal cost is a per-host add-on, otherwise it is a new vendor contract.
Datadog Database Monitoring is a separately priced product. Check its current pricing, host definitions, contract terms, and retention against the fleet you plan to monitor.
6. AWS CloudWatch Database Insights: the managed option for RDS and Aurora
CloudWatch Database Insights provides database performance monitoring for supported RDS and Aurora configurations. Evaluate its current modes and migration guidance instead of relying on legacy Performance Insights product descriptions.
Database load analysis helps investigate waits and expensive SQL. Advanced features can include execution-plan analysis and proactive recommendations, depending on engine and configuration. Retention and pricing depend on the selected mode; verify both before comparing it with a third-party tool.
Its scope is supported AWS database deployments. Confirm the exact analysis and recommendation capabilities for your engine rather than treating all Database Insights configurations as equivalent.
7. SolarWinds DPA: the enterprise IT-ops monitor
SolarWinds DPA works from wait-time analysis: averages for single and multiple statements, longest I/O waits, peak waits, with tuning advisors for index work (SolarWinds DPA page). SolarWinds claims the agentless collector uses under 1% of total resource.
The friction is procurement. DPA creates no indexes, caches nothing, and pools nothing, so you still need a pooler and a person beyond the server and the quote cycle.
8. PgBouncer, PgCat, and ProxySQL: the act layer you can run today
PgBouncer supports session, transaction, and statement pooling for PostgreSQL. PgCat adds routing capabilities for PostgreSQL, while ProxySQL supports MySQL and PostgreSQL with protocol-specific features. Upgrade and failover behavior varies by release and deployment. See the PgBouncer, RDS Proxy, and ProxySQL comparison for pooling trade-offs.
Budget backend connections across every pooler instance, database/user pool, reserve pool, and direct client. PgBouncer’s default_pool_size is per user/database pair, so dividing the server limit only by replica count is insufficient. Investigate waiting clients alongside pool partitions, authentication, transaction duration, server limits, and database saturation before increasing capacity.
Neither optimizes queries: run one beside a monitor, never instead.
Transaction pooling does not guarantee session continuity. Check the current feature matrix for session parameters, LISTEN, locks, and prepared statements. PgBouncer supports protocol-level prepared statements with nonzero max_prepared_statements; its default became 200 in release 1.24. Cast AI’s proxy has its own PostgreSQL compatibility guidance; do not assume identical behavior across poolers.
9. Cast AI Database Optimization: advisor and proxy in one product
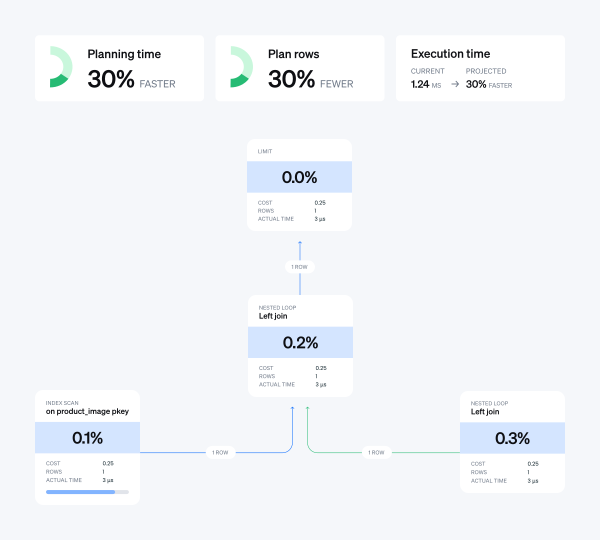
The read-only Performance Advisor analyzes supported PostgreSQL and MySQL workloads, prioritizes index and query-rewrite recommendations, and provides before-and-after plan analysis with projected impact. Review and test proposed changes before applying them. Recommendation availability depends on collected workload evidence; this comparison makes no fixed onboarding-time promise.
The optional DBO proxy adds connection pooling and caching for eligible reads. Applications point to its endpoint to use these capabilities. Benefits depend on query repetition, cache eligibility, consistency requirements, and configuration. Measure hit rate, latency, errors, and database load rather than treating vendor maximum results as expected outcomes.
Current deployment guidance covers Kubernetes and MySQL on ECS. Check the supported-platform matrix for PostgreSQL, MySQL, and managed-engine versions. The GA announcement and current Database Optimization product page explain the advisor and optional proxy.
Evaluate the proxy against a representative baseline. Record application latency, error rates, database resource use, and total cost over the workload’s normal cycles. Test passthrough and then eligible caching with a controlled rollout. Validate correctness and freshness requirements before measuring benefits. There is no universal cache-hit percentage that proves a proxy is worthwhile; compare observed gains with its overhead and operating cost.
Start with the DBO overview, then start a free trial with read-only database analysis. Enable proxy features separately after compatibility and workload validation.
Tool versus service versus hiring a DBA
What a DBA actually costs
A DBA’s cost depends on location, seniority, employment model, benefits, and on-call responsibilities. Compare a realistic local hiring budget with the specific tasks a tool or service can cover, rather than equating a software subscription with an entire role.
Consulting can be hourly, project-based, or retained. Request a scope covering investigation, implementation, validation, and handover so quotes reflect the same work.
When a consultant wins
Hire a consultant for one hard problem with a deadline: a migration you cannot roll back, a planner picking the wrong plan under load.
When a DBA hire wins
A full-time DBA can be appropriate when data modeling, reliability, capacity planning, governance, and ongoing database operations require sustained ownership. Software can support those responsibilities but does not remove accountability.
When a tool covers it
Use software for repeatable collection, prioritization, and supported optimization workflows. Compare subscription and operating cost with the engineering time saved and measured workload improvements. Retain ownership for schema review, correctness, migrations, and incident response.
Common problems these tools are bought to fix
Reading the Postgres slow query log
Postgres has no slow query log in the MySQL sense. Set log_min_duration_statement and read the server log, or query pg_stat_statements for the ranked list. The threshold decides everything: too high and the entry never appears, too low and the log becomes your slowest asset.
EXPLAIN ANALYZE and the sequential scan
A sequential scan is not a defect. On a small table, or a query returning most rows, reading the heap in order beats an index lookup. On a large table with a selective predicate it usually means a missing index or a stale statistic. EXPLAIN (ANALYZE, BUFFERS) separates planner trouble from index trouble.
How to fix an N+1 query
An N+1 shows up in pg_stat_statements as one normalized statement with an enormous call count and a tiny mean time. An index advisor will not flag it, because each call is already fast. The fix is application code: batch the lookups or load the association eagerly in the ORM.
PgBouncer too many connections
The database error too many clients already indicates exhausted connection slots. If it persists behind PgBouncer, examine aggregate backend pools, replica counts, direct clients, and reserved headroom. The cause can be oversized combined pools, not an undersized individual pool. Application-pool waiting is a separate symptom.
Conclusion
Choose by the work you need done: visibility, recommendations, controlled schema changes, or runtime pooling and caching. Match product scope and ownership to that need. Our database observability guide explains the signal layer, while database optimization techniques covers the implementation choices.
Review the GA announcement and DBO introduction, then start a free trial with read-only analysis. Add proxy pooling or caching only after validating the relevant workload requirements.
FAQ
What is the best database optimization tool?
Choose by bottleneck, engine, operational ownership, and the action required. Native tools support diagnosis; specialists add history and advice; proxies provide pooling or caching. Some tools execute schema changes when invoked, while Cast AI’s Performance Advisor remains read-only.
Are the native tools enough?
Sometimes. On one instance with a known workload, pg_stat_statements plus a weekly EXPLAIN review covers a lot, if someone does the review. Three gaps remain: no history across counter resets, no cluster-wide view of unused indexes, and no projected plans. Past that, the call is about your team time, not a fixed number.
Should I hire a database optimization service or use a tool?
Use a service for a bounded, hard problem with a deadline. Hire a full-time DBA when database work is strategic. Buy a tool when the recurring work is the optimization loop. Many teams run two of the three, which works as long as someone owns the recommendation queue.
What is the difference between monitoring and optimization tools?
Monitoring tools observe and report. Optimization tools change something. Observe tools record what happened, recommend tools diagnose and hand you a fix, act tools change the runtime path, and most vendor pages here stop at the first two. Ask which class a tool belongs to before you read its feature list.
Which tools support MySQL and PostgreSQL both?
Percona PMM, Datadog Database Monitoring, ProxySQL, and Cast AI Database Optimization support both engines, with product-specific version and feature limits. pganalyze focuses on PostgreSQL. AWS Database Insights is limited to supported RDS and Aurora deployments.
What does pganalyze not do?
pganalyze does not change your database: every index recommendation arrives as a CREATE INDEX you copy and run (pganalyze Index Advisor page). It does not pool, cache, or support MySQL. Within its scope it goes deep, particularly on plan history and vacuum analysis.
How is Cast AI DBO different?
Cast AI DBO combines a read-only advisor with an optional proxy for supported PostgreSQL and MySQL workloads. The advisor proposes reviewed index and query changes with projected plan impact. The proxy provides connection pooling and eligible read caching after configuration and a connection-string change.


