Java heap tuning in Kubernetes means setting heap capacity and garbage-collection behavior while reserving enough container memory for non-heap allocations. Measure heap occupancy across representative collection cycles, allocation rate, GC pauses, and total container memory before changing -Xmx. A small heap can increase collection pressure; an oversized memory budget can trigger a container OOM kill. This guide focuses on heap sizing and pause diagnosis, not a universal heap percentage.
Heap metrics and container metrics answer different questions. A JVM can exhaust its configured heap while the container still has memory available, or exceed its container limit while the heap remains below -Xmx. Diagnose the failure before changing the heap or the Kubernetes limit.
Key Takeaways
The mistake behind it: sizing the heap against the container limit instead of against the memory left after non-heap allocation. The following checks keep heap and container sizing aligned.
- Measure the workload. Track heap after representative collection cycles, allocation rate, and application latency.
- Budget the whole container. Leave measured room for non-heap allocations and other charged memory; no fixed heap percentage is universally safe.
- Choose a collector deliberately. Test it on the actual JDK and CPU budget; pause targets are not guarantees.
- Distinguish failure modes. Java heap exhaustion, native-memory pressure, container OOM kills, and node eviction need different evidence.
- Validate a controlled rollout. Compare pause percentiles, throughput, cgroup peaks, and errors before expanding scope.
Why heap tuning is different inside a container
A Linux memory limit is enforced through the container’s cgroup. Memory pressure at that limit can lead to an OOM kill, which can terminate Java without a JVM heap dump or java.lang.OutOfMemoryError. Exit code 137 indicates SIGKILL and is not, by itself, proof of an OOM kill. Check container termination details, events, and node evidence.
The behavior depends on the host and container configuration; a VM can also experience an OOM kill. -XX:+HeapDumpOnOutOfMemoryError handles JVM-detected out-of-memory errors and cannot intercept a kernel SIGKILL. See the OOMKilled and exit code 137 guide for diagnosis.
The opposite failure is a Java heap OutOfMemoryError below the container limit. For example, a JVM that chooses roughly 512 MiB of heap inside a 2 GiB container can exhaust that heap even though the container has spare memory. Inspect the actual flags and error type rather than assuming a default.
On supported Linux HotSpot builds, UseContainerSupport lets JVM ergonomics account for container constraints. Effective behavior depends on the JDK build, cgroup version, and explicit flags. MaxRAMPercentage is a heap-sizing input, not a cap on all process memory. Verify the running JVM with its flags and version-matched Java documentation.
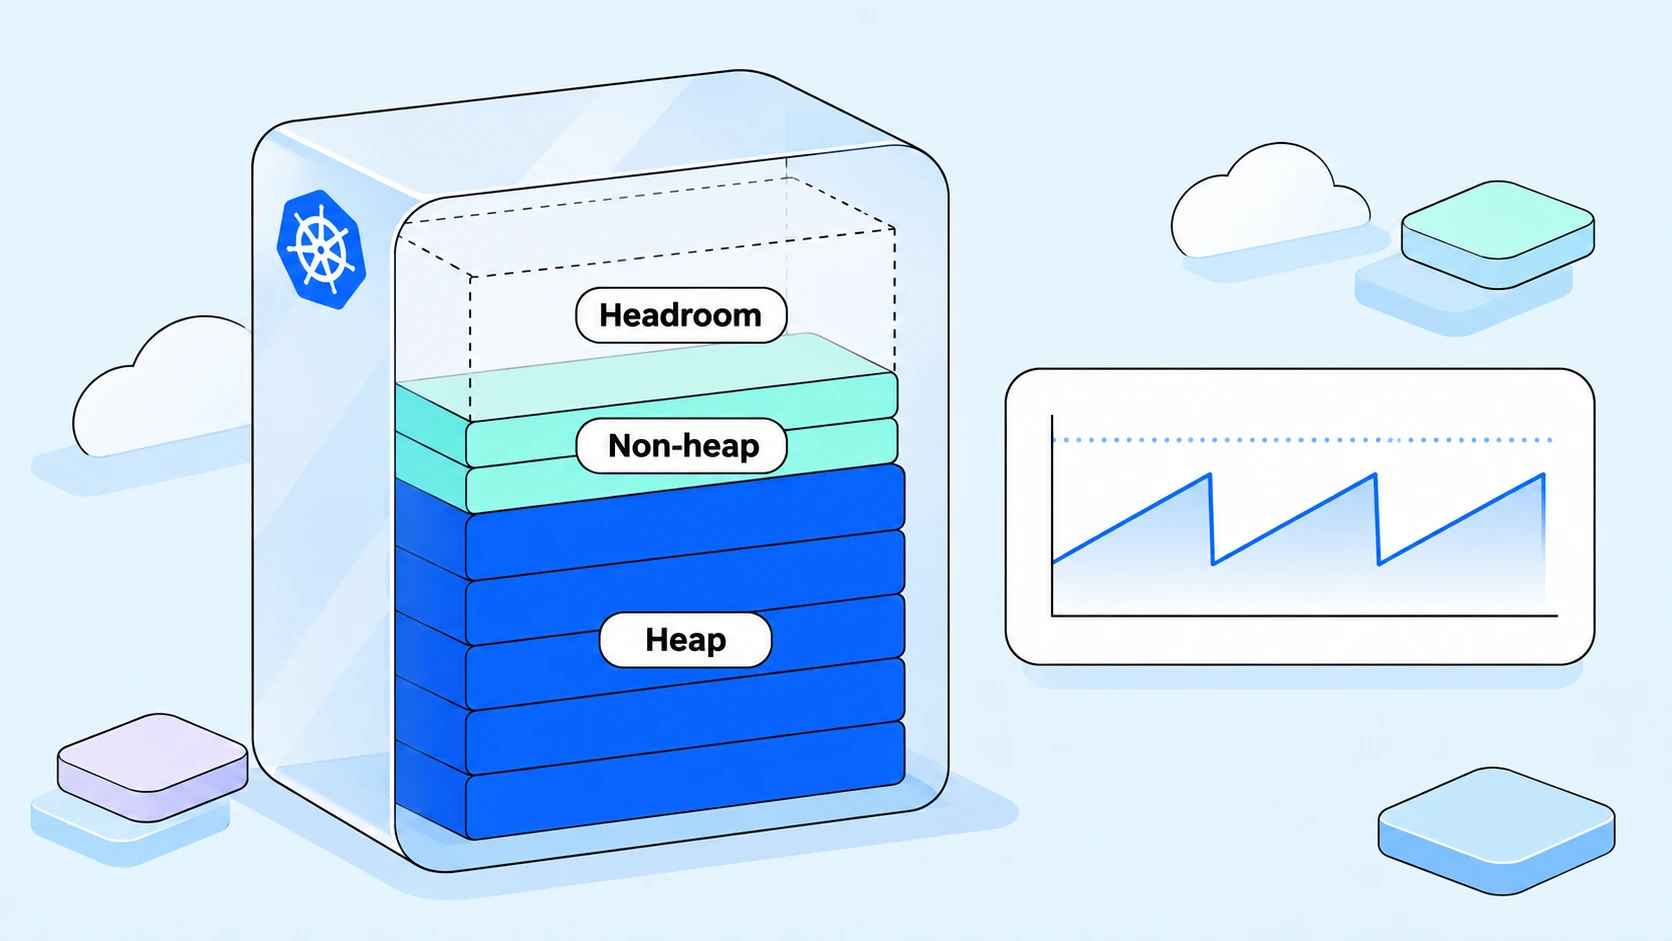
Keep these measurements separate: used heap includes allocated objects not yet reclaimed; committed heap is memory made available for the JVM heap, distinct from reserved virtual address space; process RSS counts resident process pages; and cgroup memory accounts for the container’s charged memory, including categories such as file cache and kernel memory. Neither committed heap nor process RSS is an exact substitute for the cgroup limit measurement.
Keep one lever. Set -Xmx next to -XX:MaxRAMPercentage and the explicit flag wins, leaving the percentage dead. Pick one mechanism and delete the other.
Which garbage collector for which workload?
G1 is a useful starting point for many server workloads, but collector choice depends on your JDK, CPU budget, allocation rate, heap size, and latency objective. Evaluate ZGC or Shenandoah where lower pause times justify their trade-offs, and consider Parallel GC for throughput-oriented work. No collector guarantees an application response-time bound.
Compare collectors on the exact JDK distribution you deploy. Pause behavior and resource overhead depend on the workload; the table gives selection criteria rather than unsupported millisecond benchmarks. The configuration examples later in this guide use JDK 21 HotSpot.
| Collector | Primary trade-off | Version and validation notes |
|---|---|---|
| G1 | Balances pause goals and throughput; allocation pressure can cause longer pauses. | Common server default. MaxGCPauseMillis is a soft goal. |
| ZGC | Concurrent collection aims to reduce pause time, with workload-dependent CPU and headroom needs. | On JDK 21, generational mode is opt-in with UseZGC and ZGenerational. Check later-version changes. |
| Shenandoah | Concurrent evacuation targets lower pauses; distribution support and overhead vary. | Confirm availability and supported mode in the exact JDK build. Do not assume generational mode on JDK 21. |
| Parallel | Throughput-oriented collection with stop-the-world pauses. | Evaluate for batch workloads against completion time and acceptable pauses. |
Concurrent collectors need CPU time while the application continues allocating. CPU throttling or host contention can delay collection and contribute to stalls. Guaranteed QoS does not disable CPU throttling: under the per-container model, it requires matching CPU and memory requests and limits for every container. Removing a CPU limit changes that QoS eligibility. Choose resource policy deliberately and measure throttling; see Kubernetes QoS requirements.
Benchmark the full trade-off: application throughput, pause distribution, CPU consumption, and total memory. A low-pause collector does not repair an unbounded cache or automatically make a smaller container safe.
For the JDK 21 examples here, SoftMaxHeapSize is a ZGC tuning concept, not a G1 pause control. With ZGC it is a soft heap target; the heap can still grow toward -Xmx. G1’s MaxGCPauseMillis is a goal, not a guaranteed upper bound. Consult the JDK 21 GC tuning guide for version-specific behavior.
How do I size the Java heap without constant GC?
Estimate the live-set range across representative collection cycles and traffic, then allow enough space for allocations and the selected collector. A single post-young-GC reading is not the complete live set. Validate a candidate -Xmx against throughput, pause percentiles, and total container memory before rolling it out.
Work through these steps in a representative staging environment, then validate a controlled production rollout. Do not make a forced full collection the routine production measurement method.
- Enable observability. Capture JVM pool metrics and GC logs or JFR alongside application latency and cgroup memory.
- Observe representative collection cycles. Include traffic peaks, startup, caches, and batch jobs. A young collection does not reclaim the entire heap.
- Choose a candidate heap budget. Allow room above the measured live-set range for allocation and collector work; any multiplier is a hypothesis to test.
- Budget non-heap and container memory separately. Include native allocations and other cgroup charges without double-counting them.
- Test and compare. Recheck pause percentiles, throughput, memory peaks, and errors. Investigate a rising post-collection floor rather than assuming that a larger heap fixes it.
The diagnostic commands below require a suitable JDK toolset and attach permissions. Replace PID 1 with the actual Java process ID. Start with jcmd <pid> help to confirm command support. See the jcmd reference; process namespaces and runtime permissions affect discovery and attachment.
# Replace 1 with the actual Java PID; confirm attach permissions.
jcmd 1 help
jcmd 1 VM.flags
jcmd 1 GC.heap_info
jcmd 1 VM.metaspace

# Only if Native Memory Tracking was enabled at startup:
jcmd 1 VM.native_memory summary

# Optional controlled NON-PRODUCTION experiment only:
# jcmd 1 GC.run
# jcmd 1 GC.heap_info
Prefer observations from normal collection cycles. If you need a forced collection for a controlled experiment, use a non-production replica with representative data and traffic. GC.run can have high impact, and behavior depends on collector settings. Record the collection type; do not assume every after-value measures the entire live set.
When the image has no jcmd
Minimal images may omit jcmd. Use existing JVM metrics or a JFR recording where supported. These sources provide different views; none makes process RSS a replacement for heap-pool measurements. Native Memory Tracking requires startup configuration and a supported diagnostic path.
- JVM metrics: expose used, committed, and maximum heap-pool metrics through an appropriate exporter. Metric names depend on the integration.
- Java Flight Recorder: use supported recordings to inspect GC and allocation behavior. Secure the recording and account for collection overhead.
- Native Memory Tracking: enable it at startup and inspect it through a supported JDK diagnostic path. It complements heap and cgroup metrics; it does not replace them.
Illustrative budget: a 4 GiB container limit is 4,096 MiB. Suppose representative measurements support a 2,867 MiB maximum heap and a separately measured 730 MiB allowance for non-heap and other charged memory. That totals 3,597 MiB and leaves 499 MiB of margin. Validate this budget against actual cgroup peaks; do not derive non-heap use by subtracting used heap from RSS, or count thread stacks twice.
# Illustrative Pod-spec fragment for JDK 21 HotSpot; validate under your traffic.
# The example has Burstable QoS because CPU request and limit differ.
containers:
  - name: orders-api
    image: registry.example.com/orders-api:2026.11
    resources:
      requests:
        memory: "4Gi"
        cpu: "2"
      limits:
        memory: "4Gi"
        cpu: "4"
    env:
      - name: JAVA_TOOL_OPTIONS
        value: >-
          -Xms1g
          -Xmx2867m
          -XX:+UseG1GC
          -XX:MaxGCPauseMillis=200
          -Xlog:gc*:stdout:time,uptime,level,tags
This example uses a lower initial heap than maximum heap and logs GC events to standard output. It does not impose arbitrary metaspace, code-cache, or processor-count caps. Any such cap needs separate evidence. A 200 ms G1 pause target remains a goal rather than a guarantee. The manifest is illustrative and has not been tested on your workload.
Diagnosing GC pauses: read the logs, not the latency graph
GC logs and JFR events help attribute pauses to collector activity. Correlate them with request latency, CPU throttling, and downstream timings; a latency graph alone cannot identify the cause.
The GC log flags to turn on
On JDK 9 and later, unified logging replaces the old flags. Add this line to the container Java options and mount the log directory as a volume.
-Xlog:gc*:file=/var/log/java/gc.log:time,uptime,level,tags:filecount=5,filesize=20m
# Add allocation and tenuring detail when chasing high allocation rate:
-Xlog:gc*,gc+heap=info,gc+age=trace:file=/var/log/java/gc.log:time,uptime,level,tags:filecount=5,filesize=20m
Use unified logging on JDK 9 and later. Legacy logging flags may be translated with warnings, deprecated, or rejected depending on the JDK; they are not universally ignored. Check startup output and confirm that the intended log is actually being written.
Use one logging configuration that fits the investigation. gc* provides broad GC event detail, while additional heap and age tags can support deeper analysis. File rotation limits log retention, but does not protect against an oversized heap dump or unrelated files filling the volume.
This illustrative G1 log line shows a young collection, not a measurement of the complete live set:
[12.345s][info][gc] GC(212) Pause Young (Normal) (G1 Evacuation Pause) 2891M->1620M(3072M) 38.412ms- 12.345s: elapsed time since JVM startup.
- Pause Young: the collector and phase; distinguish young, mixed, and full collections.
- 2891M → 1620M: heap occupancy before and after this collection. A young collection can leave unreachable objects in the old generation, so its after-value is not a full live-set measurement.
- 3072M: heap capacity reported for that event, not the container memory limit.
- 38.412ms: this pause duration; compare distributions over representative traffic with the application latency budget.
Alert on pause lines above your target and on any “Allocation Stall” line, which means a concurrent collector fell behind and an application thread waited.
The three usual causes and their signatures
Start with these common causes, while keeping CPU starvation, safepoints, native work, and other runtime effects in the investigation.
- A heap too small for the live set. Frequent full collections, a heap-after-GC number that creeps upward, and occasionally OutOfMemoryError with container memory free. That last one is an explicit -Xmx pinning the heap below the limit.
- An allocation rate the young generation cannot absorb. Heap size looks right, yet collections run back to back, and tenuring statistics show fast promotion. Look at string building in log statements, boxed primitives in hot loops, oversized buffers. Fix the allocation, not the collector.
- The wrong collector or conflicting flags. -Xmx next to -XX:MaxRAMPercentage, ZGC flags mixed across JDK versions, or a team expecting low pauses from G1 at 32 GB. These are configuration errors, and no heap tuning repairs them.
CPU throttling can increase elapsed pause time even when GC’s CPU work has not increased. Compare cgroup throttling counters with GC events before changing heap flags. Matching requests and limits does not eliminate throttling. The requests and limits guide explains the separate scheduling and resource-control decisions.
The container limit interaction: the gap that prevents OOMKills
-Xmx limits the Java heap, not the full container footprint. Non-heap allocations and other memory charged to the cgroup need their own budget. Inspect the actual accounting metrics exposed by your cgroup and monitoring stack.
Budget for metaspace, code cache, thread stacks, direct buffers, GC metadata, and other native allocations. Charged file cache and additional processes can also matter. Use JVM metrics, Native Memory Tracking where appropriate, and cgroup measurements together; NMT does not account for every third-party native allocation.
On glibc-based images, allocator arenas and fragmentation can contribute to native memory growth. Treat MALLOC_ARENA_MAX as an experiment tied to the actual allocator and workload, not a universal setting of 2. Measure RSS, allocation performance, and latency before and after any change.
Percentage-based heap flags make this worse on small pods. The same 300 MiB of metaspace and stacks is 8% of a 4 GiB limit and over 25% of a 1 GiB one, which argues against copying MaxRAMPercentage=75 everywhere. Work from a measured -Xmx and gap.
Container OOM killing and node-pressure eviction are different paths. The kubelet considers whether usage exceeds requests, pod priority, and usage relative to requests when ranking pressure evictions. A low request can increase exposure, but it does not prove a particular pod will be evicted first. Inspect events and node pressure alongside the container termination reason.
Thread creation can fail because of native memory pressure, process or thread limits, or other operating-system constraints. Check the error and thread count before attributing the failure to heap sizing. Increasing -Xmx can reduce available native headroom and make the problem worse.
Can heap tuning be automated safely?
Measurement and recommendation can be automated, but collector selection and rollout criteria still need workload validation. Container metrics do not directly expose JVM heap occupancy. Instrument JVM pools and GC behavior alongside total container memory; a Java heap error and a container OOM kill require different evidence.
Cast AI JVM workload optimization uses JVM runtime metrics for memory recommendations and can supply heap flags. Metrics can come from auto-instrumentation, an existing Prometheus-format endpoint, or a connected Prometheus data source. Auto-instrumentation requires Java 9 or later; Java 8 needs a compatible external metrics route. Elasticsearch and OpenSearch require an external metrics pipeline for heap scaling.
Follow the documented workload-level configuration and verify that metrics and recommendations are present. Changing heap startup flags requires starting a new JVM, even when a platform supports in-place container resource resizing. Validate one workload class first, including application latency, memory peaks, GC behavior, and restart recovery. Configure rollout availability separately from PodDisruptionBudgets; a PDB is not a universal guard for every controller-driven restart.
Setup is in the JVM optimization documentation.
Roll out the measured configuration
Use a representative workload to test heap size, non-heap allowance, and collector behavior together. Preserve a known-good configuration and expand only after a full workload cycle meets your latency and reliability criteria. To assess your environment with Cast AI, start a free trial in read-only mode. Applying workload changes is a separate, deliberate step.
Frequently asked questions
How should I choose Java heap size in Kubernetes?
Measure heap occupancy across representative collection cycles and traffic, then allow enough headroom for allocation and the collector. Budget non-heap memory and other cgroup charges separately. Validate the proposed maximum heap against application latency, throughput, and container memory peaks.
Why can a Java pod be OOMKilled while its heap is below Xmx?
Xmx limits the Java heap, not all container memory. Native allocations, thread stacks, direct buffers, metaspace, GC metadata, file cache, and other charged memory can contribute to the cgroup limit. Check termination details and memory accounting rather than relying on heap usage alone.
Which garbage collector should I use in Kubernetes?
Choose using the actual JDK, workload, CPU budget, and latency objective. G1 is a common server starting point; ZGC and Shenandoah can suit lower-pause requirements; Parallel GC can suit throughput-oriented work. Benchmark the trade-offs and verify version-specific support.
Does Guaranteed QoS prevent CPU throttling or OOM kills?
No. Guaranteed QoS does not remove CPU or memory limits. A container can still be CPU-throttled or exceed its memory limit. Under the per-container model, every container needs matching CPU and memory requests and limits to qualify.
Can GC pauses cause readiness probe failures?
Yes. A pause can delay a probe response long enough to exceed its timeout. Endpoint removal depends on the configured failure threshold, and readiness failure alone does not restart the container. Tune probes against realistic response behavior and investigate the pause cause.
Can I change Xmx by resizing a running container?
Changing a container resource limit does not by itself change the running JVM’s startup heap flags. Applying a new Xmx normally requires starting a new JVM. Coordinate the workload rollout and validate the new memory budget before expanding scope.