Amazon CloudWatch pricing can get tricky. CloudWatch’s pricing is based on three parts, just like any other observability tool: a data ingest pipeline, a place to store data, and a management console.

When using it, you’ll face costs related to ingesting data into the data store, retaining data there, and using the visualization and management tools that help you derive insights from data.
But how exactly does CloudWatch pricing work? And how can you keep tabs on it so the charges don’t spiral out of control?
Keep reading to find out—or jump directly to CloudWatch pricing best practices.
What is Amazon CloudWatch?
Amazon CloudWatch is a built-in AWS tool that keeps an eye on all of your AWS resources and applications.
Head over to the CloudWatch home page, and you’ll see metrics for every single AWS service you’re using. You can also build custom dashboards to display stats about your custom apps and metric groups.
CloudWatch lets you set up alarms that notify you when a threshold is exceeded – or even adjust the monitored resources automatically (EC2 Auto Scaling and Amazon Simple Notification Service actions)
For example, you can use CloudWatch to monitor different aspects of your EC2 instances such as CPU utilization and disk reads and writes. Once you gather enough data, you can decide whether to deploy more instances to handle the increasing load or stop underutilized instances to save money.
How do you access Amazon CloudWatch?
Head over to your AWS account and use one of the following methods to access CloudWatch:
How does CloudWatch work?
Amazon CloudWatch works like a metrics repository where services like EC2 can add their metrics, allowing you to retrieve statistics based on those metrics at any time. This graph helps to understand this:
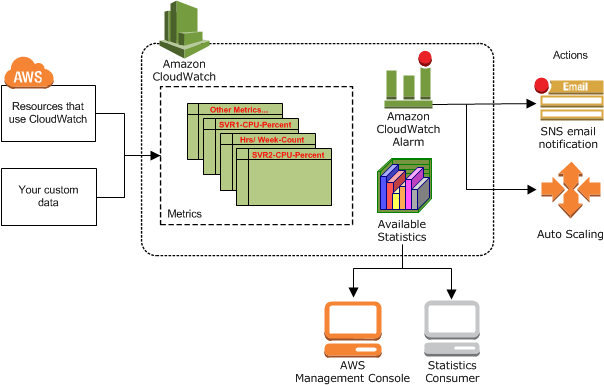
Source: AWS documentation
CloudWatch stores metrics separately per region, but thanks to the cross-region feature, it lets you aggregate statistics from different regions.
Now that we’ve gotten the fundamentals out of the way, let’s focus on pricing.
CloudWatch pricing tiers
In general, CloudWatch charges for its Metrics service based on the number of metrics submitted to it and the frequency with which the API is called to transmit or fetch a metric.
The higher your cost, the more metrics you provide to CloudWatch, and the more frequently you access the API.
This is vital to remember since the more metrics you track, the easier it is to analyze particular problems in your system. And the faster you submit data, the more detailed and exact you can be when troubleshooting service issues.
CloudWatch is mostly priced based on how accurate the data it collects and stores is. The more accurate the data, the more Cloudwatch costs.
Free
The CloudWatch free tier is applied to your service automatically before you receive any charges based on the tool’s paid tier. It comes with small allowances for every CloudWatch service, such as Metrics, Logs, and Dashboards.
AWS offers three types of free tier:
- Always free – this option doesn’t have an expiry data and is available to all users.
- 12 months free – available for 12 months from the sign up.
- Trial – trials are short-term offers counted from the moment of activating the service.
The Amazon CloudWatch free tier gives you access to:
- Basic monitoring metrics
- 10 detailed monitor metrics
- 1 million API requests
- 10 alarm metrics
- 5 GB of log data ingestion and archive
- 3 dashboards with up to 50 metrics per month
The free plan gives you a great opportunity to try out CloudWatch and check if the paid plan is a worthwhile investment.
Still, don’t forget that basic monitoring metrics are, well, pretty basic. We’re talking about a few core metrics per service to make sure that you can monitor a service for availability and high-level performance. Most AWS services like EC2, EBS, RDS, or S3 offer basic monitoring none of the tracked metrics here will be billed to your account.
Paid
The CloudWatch paid tier charges differ by region and are subject to change. To check the pricing for your region, go to the CloudWatch pricing page or use the AWS pricing calculator to check the costs for your unique use case.
In general, CloudWatch pricing will be calculated based on the features you use, like:
- Metrics
- Alarms
- Dashboards
- Events
- Logs
- Contributor insights
Note that every feature is priced differently – and some are way pricier than others.
Consider this example:
Pricing for the US (East) Ohio region is as follows:
- First 10,000 metrics – $0.30
- Next 240,000 metrics – $0.10
- Next 750,000 metrics – $0.05
- Over 1,000,000 metrics – $0.02
- API – $0.01 per 1000 metrics requested
- Dashboards – $3.00 per dashboard
- Alarm – $0.10 per alarm metric at a standard resolution of 60 seconds
- Logs – $0.50 per GB of data collected; $0.03 per GB for data stored
4 best practices for CloudWatch costs
1. Monitor EC2 like a pro
- Remember about memory – The basic monitoring metrics for EC2 instance are CPU load, disk I/O, and network I/O metrics. What about memory? Well, you need to set up a custom metric to track this!
- Choose detailed monitoring when needed – By default, Amazon EC2 sends data to CloudWatch in 5-mi intervals. If this level of monitoring isn’t enough for you, go for detailed monitoring, which delivers metrics in 1-min intervals to help you act faster. Note: from a price standpoint, detailed monitoring charges all of the basic monitoring measures as specialized metrics.
For instance, let’s say you run 12 EC2 instances and set them up for detailed monitoring. You’ll have to pay $22.2 for your CloudWatch Metric each month. The common EC2 instance types have 7 built-in metrics tracked for them by default. So:
7 metrics per instance * 12 instances = 84 metrics in total
Sure, you get 10 metrics for free as part of the CloudWatch free tier, so AWS will charge you for 74 metrics. And for the first 10k metrics, the charge per metric is $0.30/month: 74 metrics * $0.30 = $22.2 per month.
- Don’t get fooled by custom metrics – they’re tracked differently from built-in metrics as you pay for the amount of custom metrics tracked as well as the number of API calls made.
So, if you want to monitor memory use at a resolution faster than 1 minute, your API calls will grow too. For example, if you want to track memory use at a 15-second resolution, you’ll have to pay four times the amount in API expenses because the API request will be performed four times every minute.
2. Consider dimensions
Every metric has unique qualities that define it, and dimensions work like categories for those traits. A metric might be CPU usage, while a dimension could be CPU core.
On multi-core devices, this might result in CloudWatch tracking a large number of CPU metrics. Dimensions are part of a metric’s unique identifier; adding a unique name/value combination to one of your metrics creates a new variant of that metric.
Even though the metrics have the same name, CloudWatch interprets each unique combination of attributes as a different measure.
When deciding whether to track certain dimensions of a metric, it’s critical to consider the dimension’s cardinality. High-cardinality metrics, like an IP address or a unique identifier, can cause the number of CloudWatch metrics collected to grow, which can cause your AWS costs to go up by a large amount.
3. Remove custom metrics you don’t need
Metrics strike a balance between data precision and cost. The more data you gather, the more information you’ll have that will come in handy when you need to understand what went wrong when a service fails.
Internal services and less essential external services can withstand some amount of service disruption. Prioritizing the importance and impact of a service correctly will help you to choose which services need additional monitoring expenditures.
Mission-critical services should record the most metrics with the highest resolution, while less important services can record the fewest metrics and have the lowest resolution to keep costs down.
Don’t forget that Custom Metrics and EC2 Detailed Monitoring are premium monitoring options. Excessive or too comprehensive monitoring won’t improve your system’s performance but drives costs.
Before monitoring a metric, consider whether it will help diagnose a specific issue. If a metric is already being recorded, check to see if it has been useful in the past and should be watched again. Can Basic Monitoring be sufficient if a service is not a high priority?
4. Lower the resolution of metrics when you don’t need high resolution
Address the metric resolution too! High-resolution metrics might be useful during an analysis to discover a needle in a haystack, but they come at a cost.
If a service is so critical that learning about a problem within seconds is critical, then use a high-resolution measure. If a 5-minute delay in sending metrics and not being able to make metrics more detailed are fine for the service, limiting the resolution of metrics will save you money on Cloudwatch costs.
Use free cost monitoring to keep other costs in check
The on-demand pricing structure makes it hard to control the cost of AWS services like Cloudwatch pricing. Luckily, there are solutions on the market that help you do that for free.
If you use EKS, AKS, GKE, or OpenShift on AWS, the CAST AI Kubernetes cost monitoring module will give you free information about costs, such as the total cost of the cluster and costs per namespace or label.
Connect your cluster and analyze your cloud costs in real time to never go over budget again.
CAST AI clients save an average of 63% on their Kubernetes bills
Connect your cluster and see your costs in 5 min, no credit card required.


Leave a reply